E.on Se dividend yield calculator – E.ON SE Announces 0.550647 Cash Dividend
June 12, 2023

🌥️Dividends Yield
E.ON SE ($BER:EOAA) has announced a 0.550647 cash dividend on May 25, 2023, which is higher than the past three years’ dividends of 0.48 EUR, 0.48 EUR, and 0.47 EUR respectively. This higher dividend yield is estimated to be 5.62%, resulting in an average dividend yield of 5.38%. This potentially makes it a viable option for those looking to invest in dividend stocks, as the ex-dividend date is set for May 18, 2023. By investing in E.ON SE, investors can potentially benefit from the higher dividend yields. For the past three years, E.ON SE has maintained a consistent dividend yield of 5.26% and 5.26%, and with the increased dividend amount in 2023, the dividend yield has gone up to 5.62%.
The higher dividend yield could be indicative of the company’s strong financial performance over the past year and its commitment to reward shareholders with increased dividends. In conclusion, E.ON SE is an attractive option for those looking to invest in dividend stocks. With its improved financial performance and increased dividend amount in 2023, investors can benefit from the higher dividend yields. Therefore, investors should consider investing in E.ON SE if they are looking to benefit from a steady stream of income in the form of dividends.
Market Price
Following the announcement, E.ON SE stock opened at €11.2 and closed at €11.1, representing a slight decrease of 0.9% from the prior closing price of €11.2. This marked the lowest close for the company in the last fortnight. Despite this dip, investors remain optimistic about E.ON SE as they look forward to receiving their dividend payouts at the end of April. Live Quote…
About the Company
Income Snapshot
Below shows the total revenue, net income and net margin for E.on Se. More…
| Total Revenues | Net Income | Net Margin |
| 119.7k | 933 | -1.0% |
Cash Flow Snapshot
Below shows the cash from operations, investing and financing for E.on Se. More…
| Operations | Investing | Financing |
| 9.87k | -4.02k | -5.75k |
Balance Sheet Snapshot
Below shows the total assets, liabilities and book value per share for E.on Se. More…
| Total Assets | Total Liabilities | Book Value Per Share |
| 125.32k | 103.18k | 5.68 |
Key Ratios Snapshot
Some of the financial key ratios for E.on Se are shown below. More…
| 3Y Rev Growth | 3Y Operating Profit Growth | Operating Margin |
| 34.0% | -23.9% | 1.8% |
| FCF Margin | ROE | ROA |
| 4.2% | 8.9% | 1.0% |
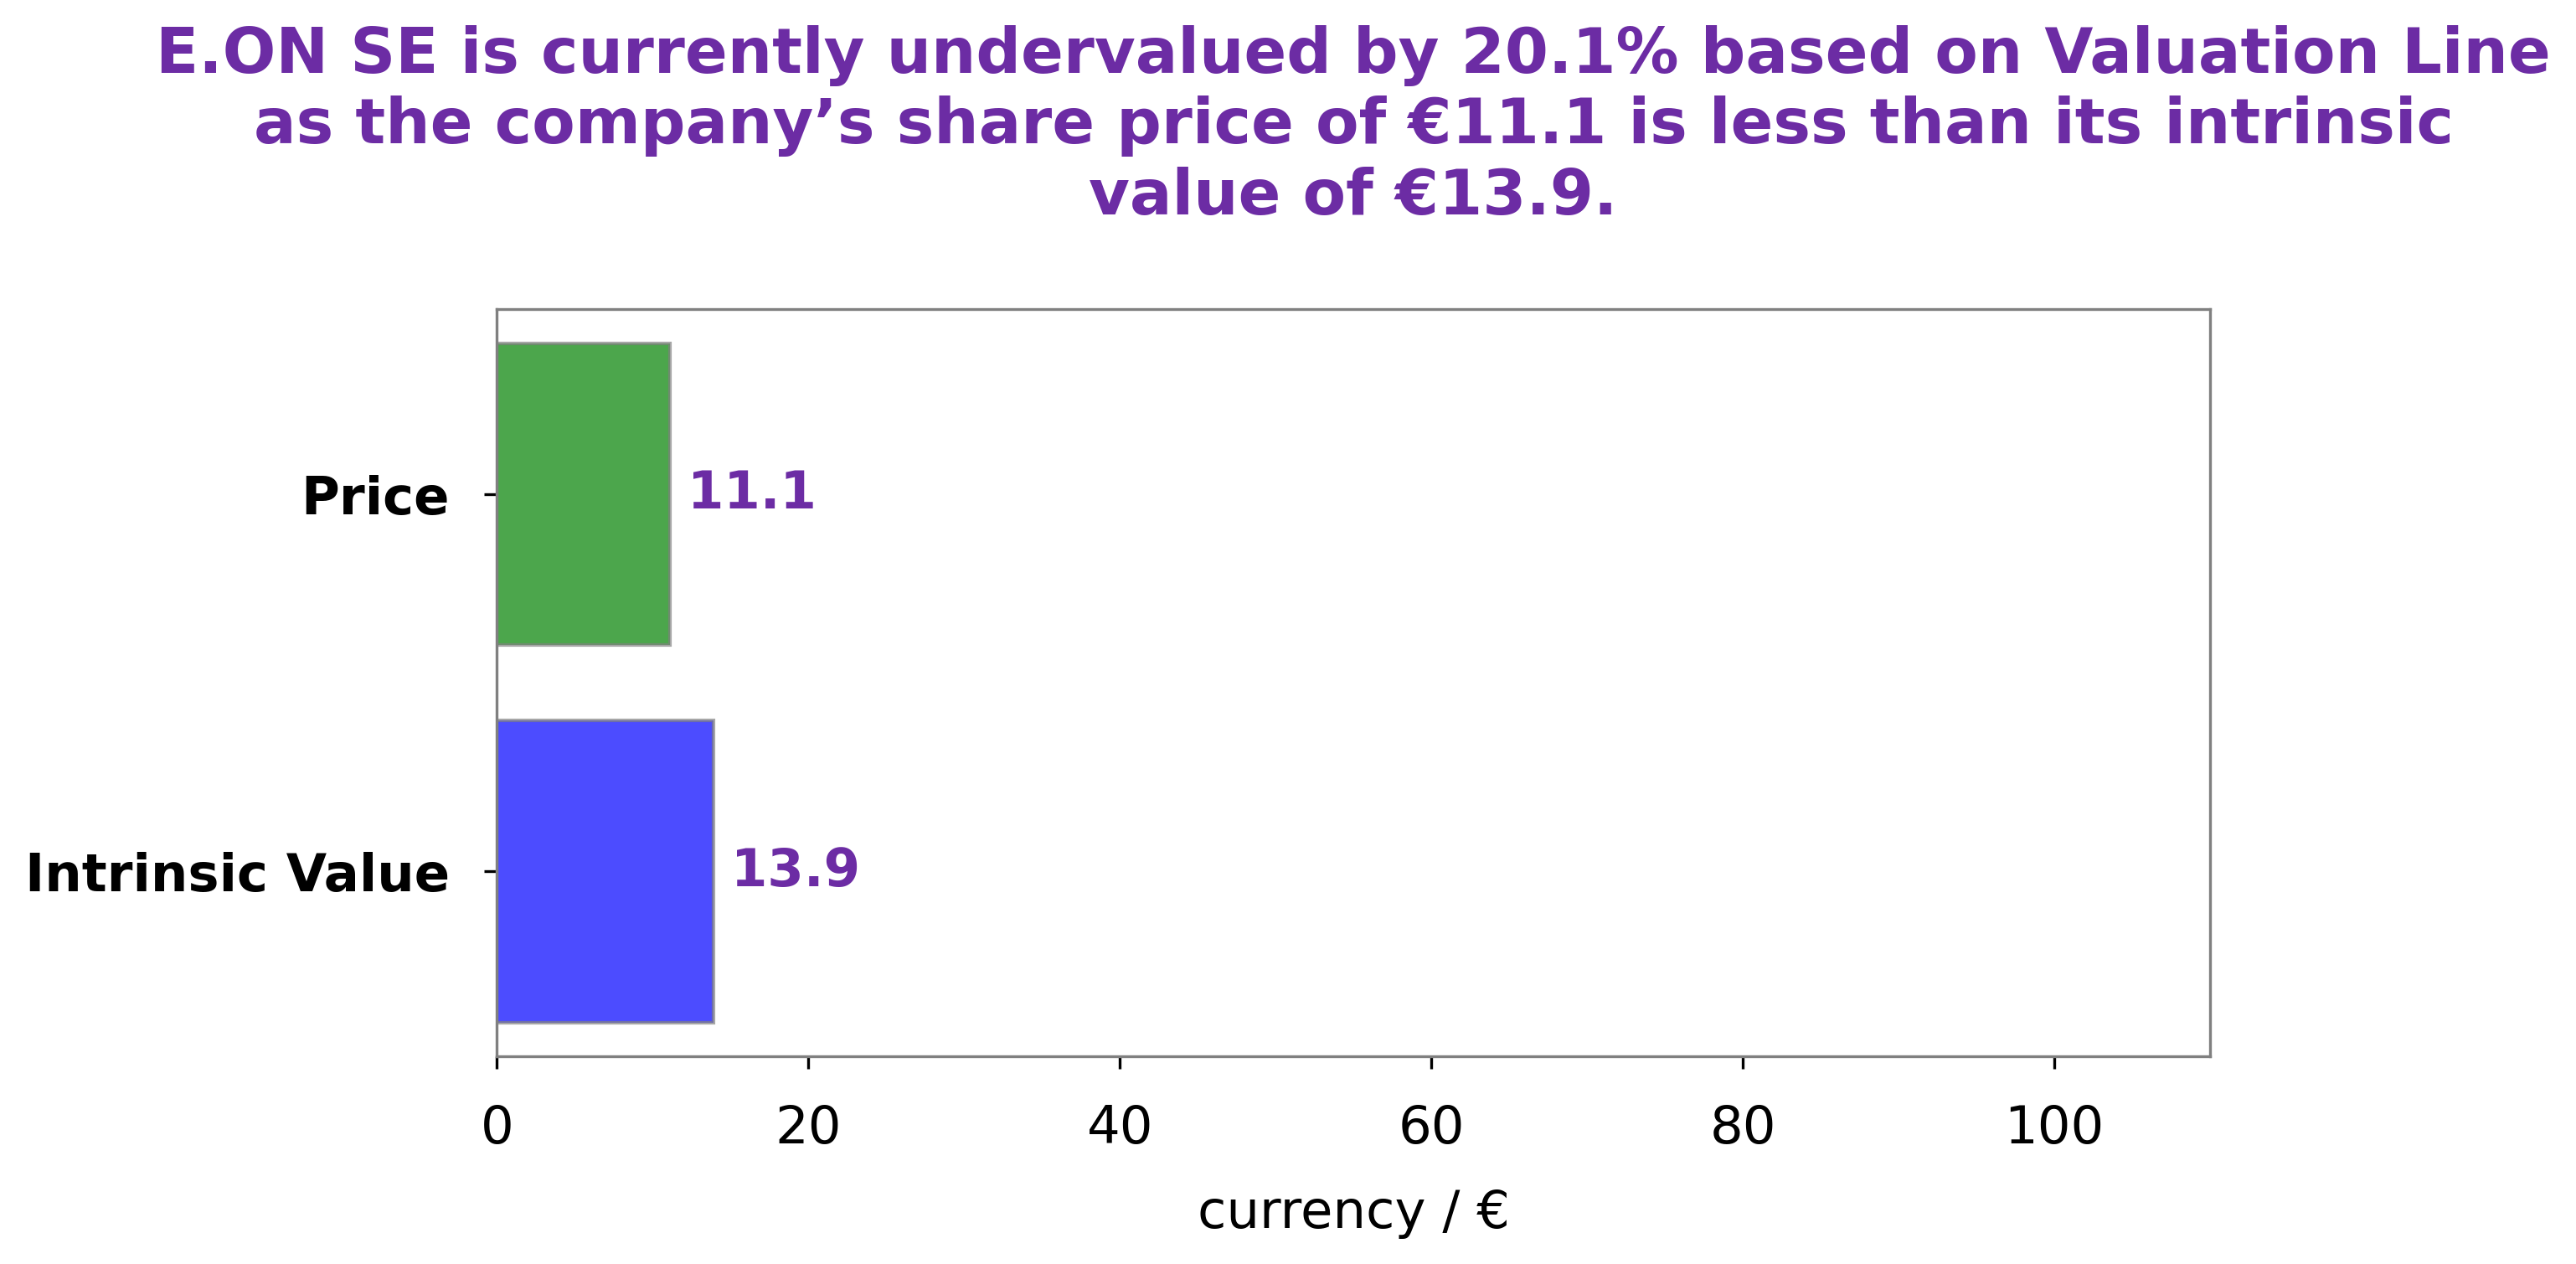
Analysis – E.on Se Intrinsic Value
At GoodWhale, we recently conducted an analysis of E.ON SE to determine its wellbeing. Upon completion of our research, we calculated the fair value of E.ON SE stock to be around €13.9 using our proprietary Valuation Line. We have found that E.ON SE is currently trading on the market at €11.1, presenting us with a 20.3% undervaluation opportunity for potential investors. More…
Peers
It is one of the largest suppliers of electricity and gas in Europe, with operations spanning from the UK to Scandinavia, Central and Eastern Europe, and beyond. Its competitors include Yu Group PLC, Electricite de France SA, and Via Renewables Inc. All of these companies are engaged in the production and sale of electricity, and are working to meet the growing global demand for renewable energy sources.
– Yu Group PLC ($LSE:YU.)
Yu Group PLC is an energy and services company headquartered in the UK, specializing in electricity and gas services to residential and commercial customers. The company also provides energy procurement, utility infrastructure installation and maintenance services. With a market cap of 106.64M as of 2023, Yu Group PLC has experienced steady growth over the past few years. Additionally, the company boasts a healthy Return on Equity (ROE) of 25.95%, well above the industry average of 15%. This indicates that the company is generating good returns for its investors, as well as demonstrating the effectiveness of its management and utilization of resources.
– Electricite de France SA ($BER:E2F)
Re-Newables Inc is a renewable energy corporation that specializes in developing and operating renewable energy projects. The company is dedicated to minimizing the environmental impact of energy production while providing reliable, sustainable energy solutions for customers. As of 2023, Re-Newables Inc has a market cap of 37.97M and a Return on Equity of -10.9%. This market cap demonstrates the potential for investors in this sector, while the negative ROE suggests that the company is failing to generate profits at the moment. Nonetheless, the company is still in its early stages and could see major improvements in revenue in the near future.
Summary
E.ON SE is a good investment option, as it has consistently paid dividends for the past three years. The dividends per share for 2021, 2022, and 2023 are estimated to be 0.48 EUR, 0.48 EUR, and 0.47 EUR, respectively. This translates to dividend yields of 5.26%, 5.26%, and 5.62%. The average dividend yield is 5.38%, which is a competitive rate for investors.
Additionally, the company’s financials and operations have been stable thus far and are expected to remain so in the near future.
Related Posts


Recent Posts


Investing Everyone Can Do.
Investing shouldn’t be exclusive to a select few. We believe everyone should have the opportunity to grow their wealth. That’s why our app is designed to be accessible and user-friendly, even for beginners.
