Dexterra Group dividend yield calculator – Dexterra Group Declares 0.0875 Cash Dividend
June 8, 2023

🌥️Dividends Yield
On June 1 2023, DEXTERRA GROUP ($TSX:DXT) Inc. declared a 0.0875 cash dividend. If you are looking for dividend stocks, DEXTERRA GROUP could be an option as the company has had a consistent pattern of issuing dividends over the past three years. In 2021, the annual dividend per share was 0.35 CAD, followed by 0.35 CAD in 2022 and 0.32 CAD in 2023. This gives a dividend yield of 6.16%, 5.64%, and 4.57% from 2021 to 2023, with an average dividend yield of 5.46%.
The ex-dividend date for this stock is June 29 2023. For investors looking for a steady source of income, DEXTERRA GROUP could be a viable option to consider.
Price History
At the same time, DEXTERRA GROUP stock opened at CA$5.4 and closed at CA$5.6, up by 4.3% from the previous closing price of 5.4. This suggests that investors are pleased with the company’s latest announcement and are confident in the future of DEXTERRA GROUP’s operations. Live Quote…
About the Company
Income Snapshot
Below shows the total revenue, net income and net margin for Dexterra Group. More…
| Total Revenues | Net Income | Net Margin |
| 1.02k | 7.14 | 0.7% |
Cash Flow Snapshot
Below shows the cash from operations, investing and financing for Dexterra Group. More…
| Operations | Investing | Financing |
| 75.46 | -9.76 | -65.7 |
Balance Sheet Snapshot
Below shows the total assets, liabilities and book value per share for Dexterra Group. More…
| Total Assets | Total Liabilities | Book Value Per Share |
| 630.94 | 344.7 | 4.38 |
Key Ratios Snapshot
Some of the financial key ratios for Dexterra Group are shown below. More…
| 3Y Rev Growth | 3Y Operating Profit Growth | Operating Margin |
| 55.0% | -8.3% | 1.8% |
| FCF Margin | ROE | ROA |
| 6.2% | 4.0% | 1.8% |
Analysis
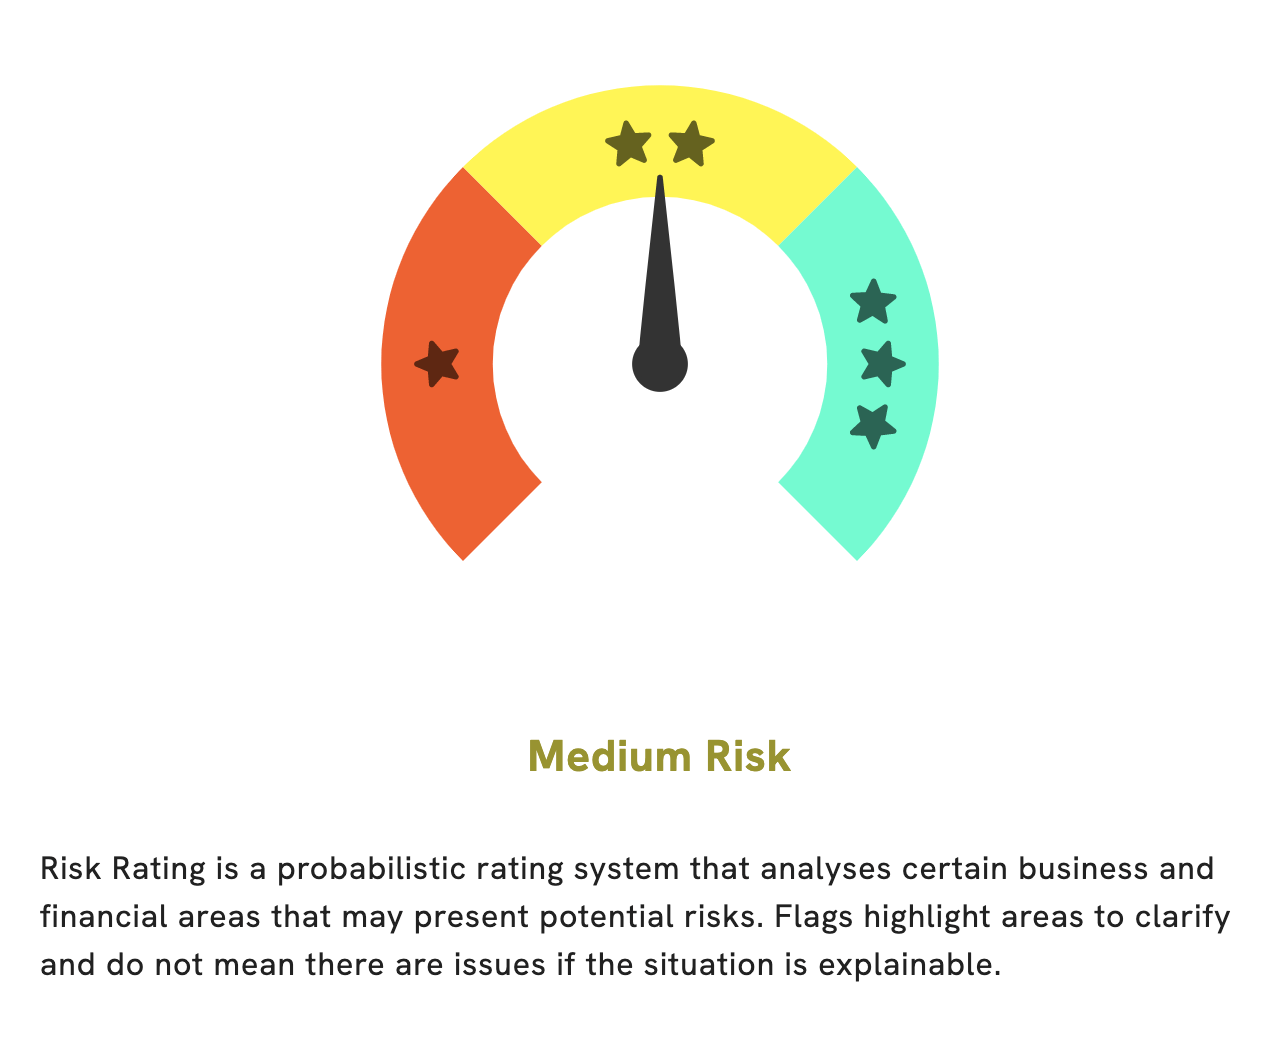
As GoodWhale, we have examined the basics of DEXTERRA GROUP. After our assessment, we have concluded that it is a medium risk investment in terms of financial and business aspects. During our assessment, we detected one risk warning related to its balance sheet. If you are interested to learn more about this risk warning, you can always register with us to check it out. More…
Peers
The competition between Dexterra Group Inc and its competitors, Capita PLC, Teleperformance SE, and Hudson Global Inc, is fierce. All four of these companies are vying for market share in the industry, using a variety of strategies to gain a competitive advantage. Despite their differences, each of these firms strives for innovation and excellence in order to outshine their competitors and gain an edge in the marketplace.
– Capita PLC ($LSE:CPI)
Capita PLC is a London-based outsourcing and professional services company that provides consulting, technology, and managed services to businesses, governments, and other organizations. The company has a market cap of 651.81M as of 2023, which indicates that the company is highly valued by investors as it is one of the largest and most profitable companies in its sector. Additionally, Capita PLC has an impressive Return on Equity (ROE) of 18.44%, which is a strong indication of the company’s profitability. This suggests that the company is well-managed and generating healthy returns for its shareholders.
– Teleperformance SE ($OTCPK:TLPFY)
Teleperformance SE is a global customer experience management company providing services to some of the world’s leading companies. It provides customer experience analytics, technology, and services across many different countries, making it a leader in its field. As of 2023, Teleperformance SE has a market cap of 14.06B and a Return on Equity of 17.15%. This market cap value reflects the company’s strong performance and stability, as well as its ability to deliver quality products and services. The high Return on Equity indicates that the company is making positive returns on its investments and is able to generate profits for its shareholders. This makes it an attractive option for investors looking for reliable and consistent returns.
– Hudson Global Inc ($NASDAQ:HSON)
Hudson Global Inc is a staffing and consulting services firm, providing specialized and professional recruiting services to its clients. As of 2023, the company has a market capitalization of 68.09M, which reflects the company’s financial performance and stability. Hudson Global Inc also enjoys a Return on Equity of 16.0%, which indicates that the company is successfully generating returns for its shareholders. This is further evidence of the company’s strong financial position and successful management strategy.
Summary
DEXTERRA GROUP is a great option for dividend investors. Over the past three years, the company has issued an annual dividend per share of 0.35 CAD, 0.35 CAD, and 0.32 CAD respectively, giving a dividend yield of 6.16%, 5.64%, and 4.57% from 2021 to 2023 with an average dividend yield of 5.46%. The company is potentially a good long-term investment as the dividend yield is strong and consistent. Investors should do their own research to decide if the stock is right for them.
Related Posts


Recent Posts


Investing Everyone Can Do.
Investing shouldn’t be exclusive to a select few. We believe everyone should have the opportunity to grow their wealth. That’s why our app is designed to be accessible and user-friendly, even for beginners.
