Dollar General Intrinsic Value Calculation – Dollar General Reports First Quarter Earnings Results for 2024 Fiscal Year
June 19, 2023

🌥️Earnings Overview
On June 1 2023, DOLLAR GENERAL ($NYSE:DG) reported their earnings results for the first quarter of the 2024 fiscal year (ending April 30 2023). Total revenue was USD 9342.8 million, a 6.8% rise year-over-year, however, net income was USD 514.4 million, a 6.9% decrease from the previous year.
Market Price
The news sent the stock plunging by 19.5%, opening at $178.9 and closing at $161.9, significantly lower than the previous closing price of 201.1. The overall market performance was not as bad as some had feared, given the recent economic struggles due to the pandemic. Despite this, DOLLAR GENERAL still experienced an unusually sharp decline in share price. Analysts attributed the steep drop to the company’s weak same-store sales that were slightly below expectations, as well as its slower-than-expected progress in their cost savings initiative. The company attempted to reassure investors by reiterating their commitment to execute their growth strategies and capitalize on their unique position in an increasingly competitive retail landscape.
However, investors remain unconvinced, and the stock’s future performance remains uncertain. Live Quote…
About the Company
Income Snapshot
Below shows the total revenue, net income and net margin for Dollar General. More…
| Total Revenues | Net Income | Net Margin |
| 38.44k | 2.38k | 6.2% |
Cash Flow Snapshot
Below shows the cash from operations, investing and financing for Dollar General. More…
| Operations | Investing | Financing |
| 1.73k | -1.64k | -112.6 |
Balance Sheet Snapshot
Below shows the total assets, liabilities and book value per share for Dollar General. More…
| Total Assets | Total Liabilities | Book Value Per Share |
| 29.8k | 23.87k | 27.06 |
Key Ratios Snapshot
Some of the financial key ratios for Dollar General are shown below. More…
| 3Y Rev Growth | 3Y Operating Profit Growth | Operating Margin |
| 9.1% | 7.7% | 8.6% |
| FCF Margin | ROE | ROA |
| 0.2% | 36.2% | 7.0% |
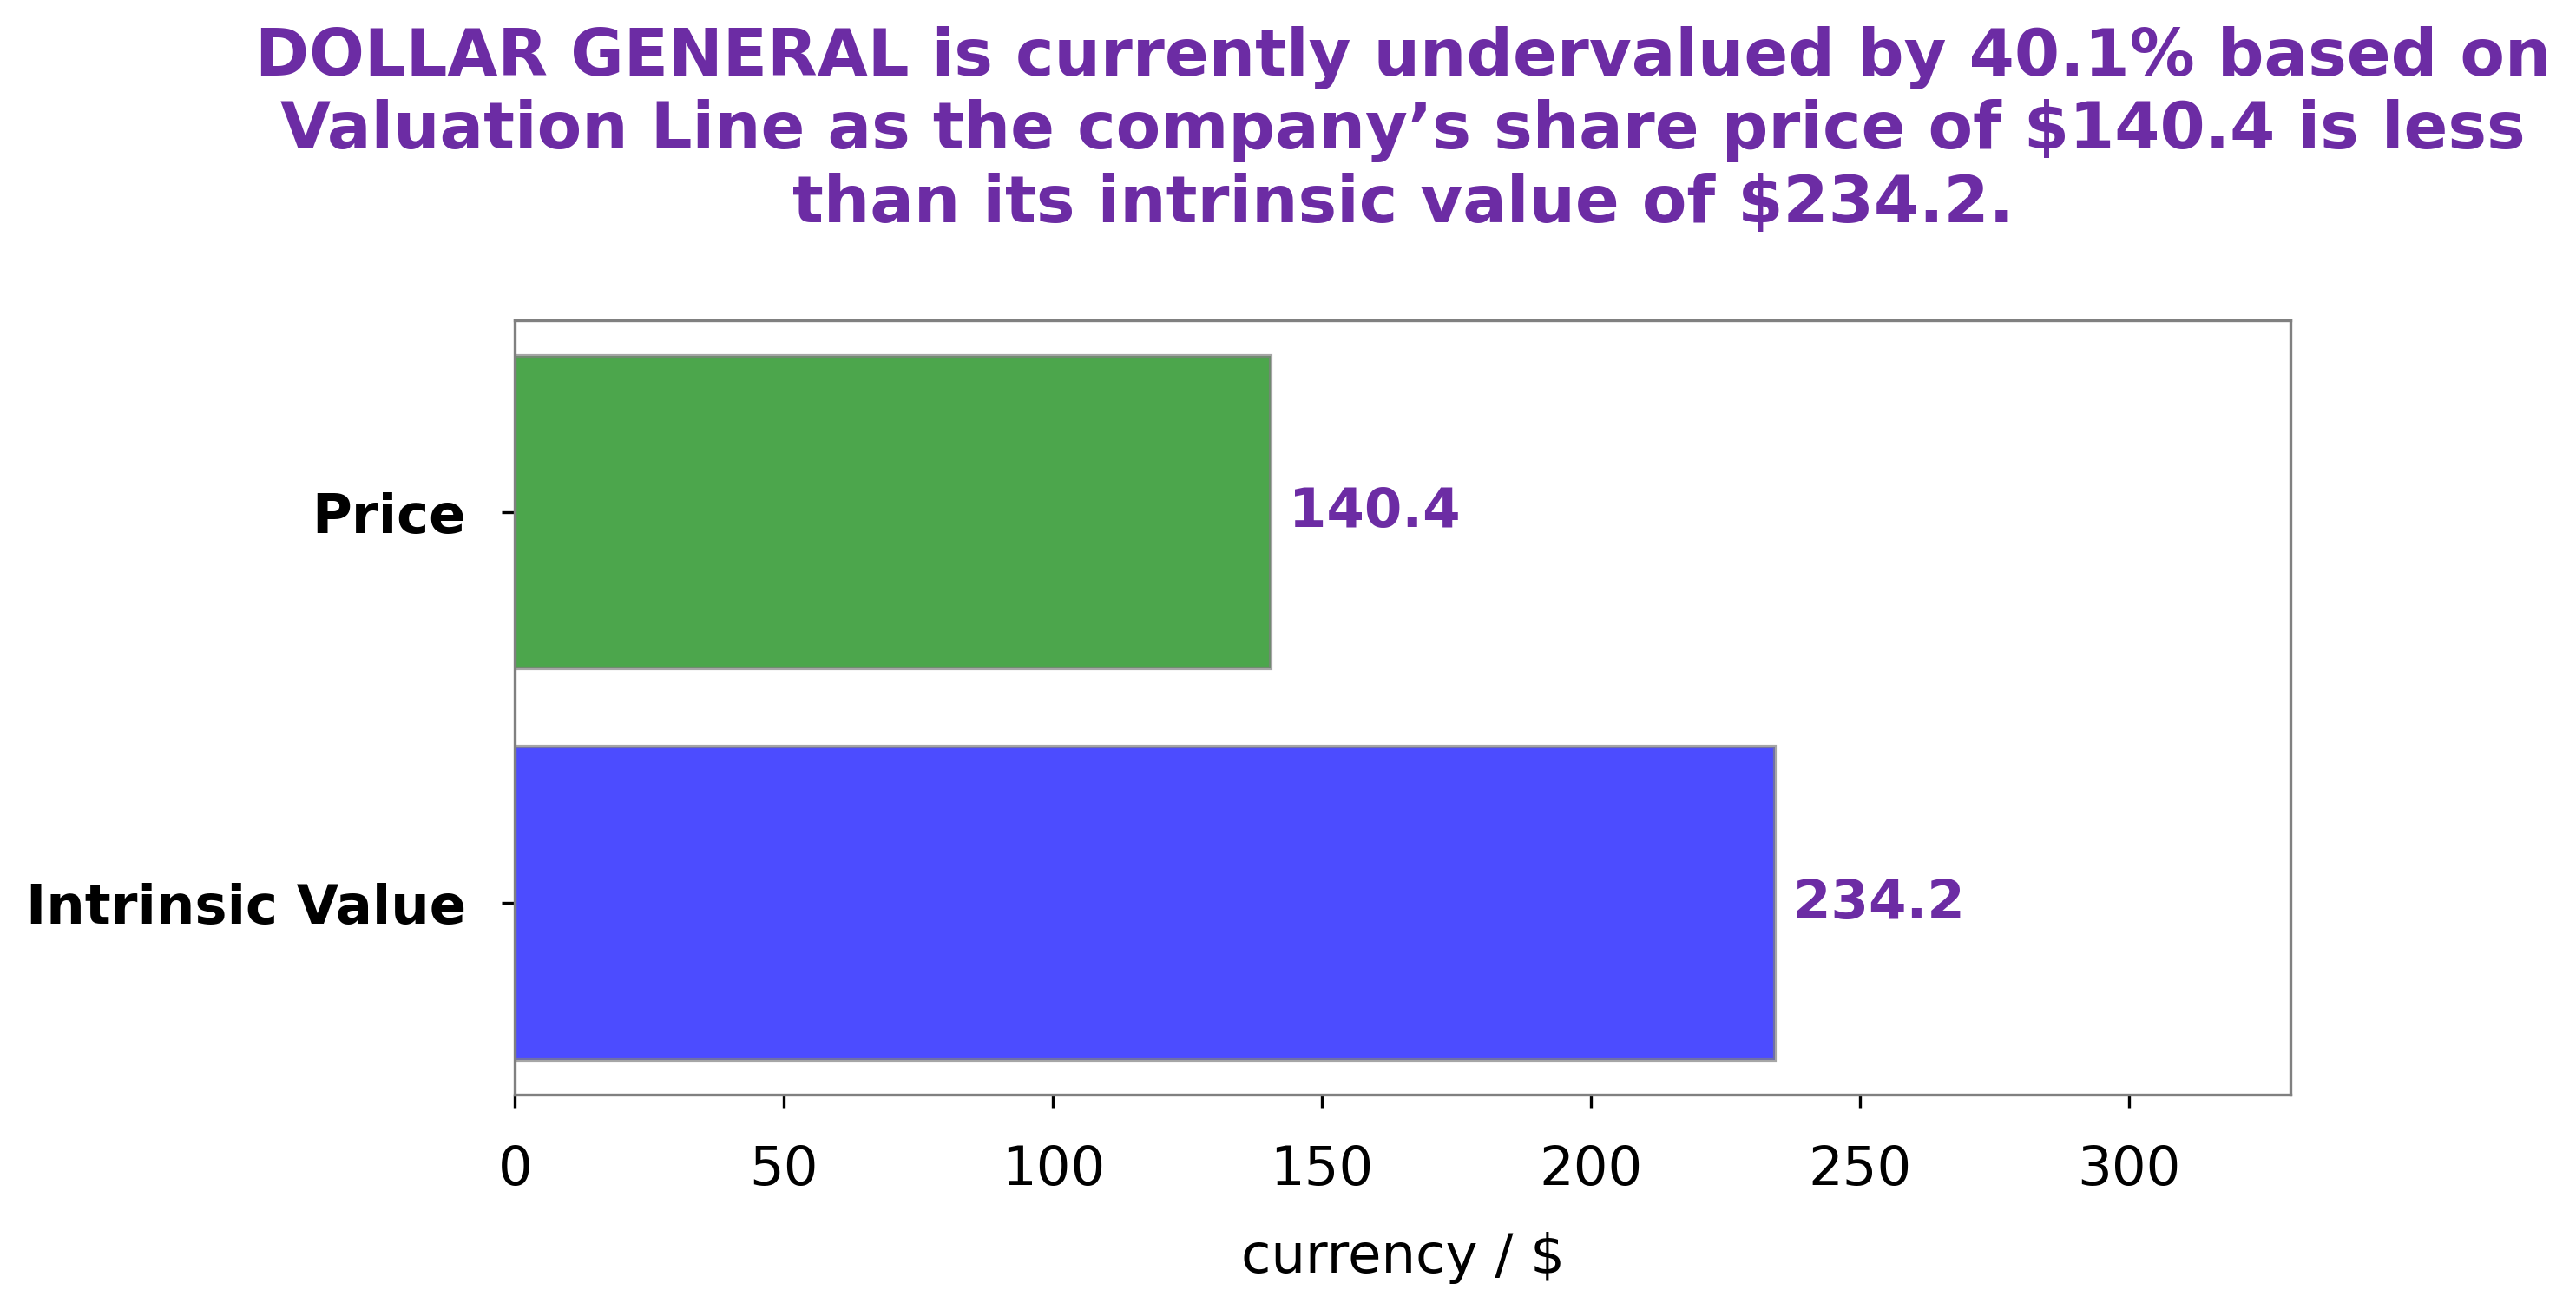
Analysis – Dollar General Intrinsic Value Calculation
At GoodWhale, we recently conducted a fundamental analysis of DOLLAR GENERAL, to determine its fair value. After weighing all the available data points, our proprietary Valuation Line set the fair value of DOLLAR GENERAL share at around $254.6. However, at the time of writing, the stock is being traded at $161.9, meaning it is currently undervalued by 36.4%. This presents investors with an attractive opportunity to buy DOLLAR GENERAL stock at a discounted price. More…
Peers
Dollar General Corp and its competitors, Dollar Tree Inc, Walmart Inc, Target Corp, are all vying for a share of the retail market. Dollar General has been able to stay ahead of the competition by offering a variety of products at a lower price point.
However, the other companies are not far behind and are constantly innovating to try and win over customers. It is an ongoing battle to see who can provide the best value to shoppers.
– Dollar Tree Inc ($NASDAQ:DLTR)
Dollar Tree is a company that operates at a low margin, high volume business model. The company offers a wide variety of merchandise at a low price point of $1.00. The company has a market cap of $35.49B as of 2022 and a ROE of 15.97%. The company has been able to grow its earnings at a double-digit rate over the past few years.
– Walmart Inc ($NYSE:WMT)
Walmart Inc is an American multinational retail corporation that operates a chain of hypermarkets, discount department stores, and grocery stores. Headquartered in Bentonville, Arkansas, the company was founded by Sam Walton in 1962 and incorporated on October 31, 1969. As of January 31, 2020, Walmart has 11,484 stores and clubs in 27 countries, operating under 55 different names. The company operates under the name Walmart in the United States and Canada, as Walmart de México y Centroamérica in Mexico and Central America, as Asda in the United Kingdom, as the Seiyu Group in Japan, and as Best Price in India. It has wholly owned operations in Argentina, Chile, Canada, and South Africa. Since August 2018, Walmart only holds a minority stake in Walmart Brasil, with 20% of the company’s shares, and private equity firm Advent International holding 80% ownership of the company.
– Target Corp ($NYSE:TGT)
Target Corp is a large retail company with a market cap of 75.6B as of 2022. The company has a return on equity of 34.09%. Target Corp is a retailer that sells a variety of products including clothing, electronics, and home goods. The company has over 1,800 stores in the United States and also has an online store. Target is a publicly traded company and its ticker symbol is TGT.
Summary
Despite this positive revenue growth, the stock price dropped the same day, suggesting a cautious outlook for investors. Analysts will likely be closely watching the company’s performance over the next few quarters to better understand how the company will fare in the current economic climate.
Related Posts


Recent Posts


Investing Everyone Can Do.
Investing shouldn’t be exclusive to a select few. We believe everyone should have the opportunity to grow their wealth. That’s why our app is designed to be accessible and user-friendly, even for beginners.
