RadNet, Shares Reach New 52-Week High of $32.02
June 14, 2023

☀️Trending News
RADNET ($NASDAQ:RDNT): RadNet, Inc. has been making headlines in the stock market as its stock price recently achieved a new 52-week high of $32.02 during Friday’s mid-day trading session. RadNet, Inc. is a leading provider of diagnostic imaging services in the United States. The company has benefited from strong performance in its core business, as well as from strategic acquisitions that have increased its footprint in the industry.
The company has also recently announced plans to expand its services internationally, further bolstering its position in the market. RadNet’s success in the stock market is reflective of its strong financial performance, and investors have responded positively to the company’s prospects.
Stock Price
RadNet, Inc., a provider of diagnostic imaging services, saw its shares reach a new 52-week high of $32.02 on Monday. The stock opened at $32.1 and closed at $32.5, up 1.3% from its previous closing price of $32.1. The stock has been seeing an upward trend over the past week with investors showing optimism in the company’s future prospects. This new 52-week high is a testament to the positive sentiment that surrounds the stock. Live Quote…
About the Company
Income Snapshot
Below shows the total revenue, net income and net margin for Radnet. RadNet_Shares_Reach_New_52-Week_High_of_32.02″>More…
| Total Revenues | Net Income | Net Margin |
| 1.48k | -13.37 | -1.4% |
Cash Flow Snapshot
Below shows the cash from operations, investing and financing for Radnet. RadNet_Shares_Reach_New_52-Week_High_of_32.02″>More…
| Operations | Investing | Financing |
| 178.13 | -250.94 | 93.14 |
Balance Sheet Snapshot
Below shows the total assets, liabilities and book value per share for Radnet. RadNet_Shares_Reach_New_52-Week_High_of_32.02″>More…
| Total Assets | Total Liabilities | Book Value Per Share |
| 2.41k | 1.92k | 5.63 |
Key Ratios Snapshot
Some of the financial key ratios for Radnet are shown below. RadNet_Shares_Reach_New_52-Week_High_of_32.02″>More…
| 3Y Rev Growth | 3Y Operating Profit Growth | Operating Margin |
| 8.3% | 0.2% | 5.1% |
| FCF Margin | ROE | ROA |
| -6.1% | 14.2% | 1.9% |
Analysis
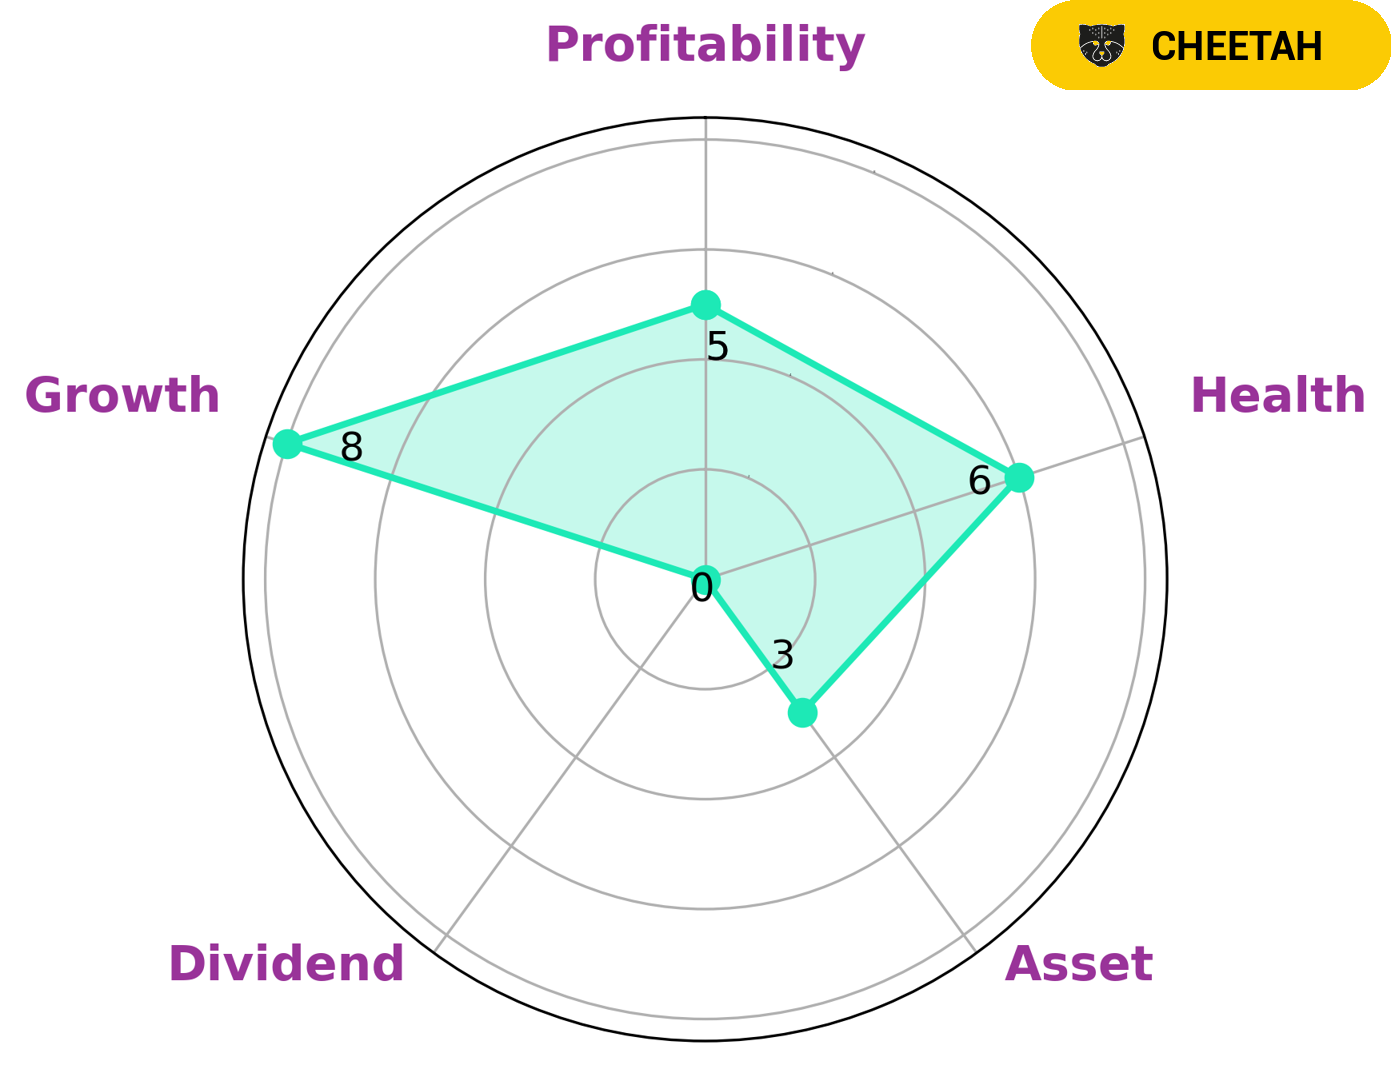
At GoodWhale, we analyzed the fundamentals of RADNET to provide insight on its prospects. Our Star Chart has identified that RADNET is strong in , medium in growth, profitability and weak in asset, dividend. Given this assessment, we have classified RADNET as a ‘rhino’, which indicates that it has achieved moderate revenue or earnings growth. With regard to its cashflows and debt, RADNET has an intermediate health score of 6/10, suggesting that it is likely to safely ride out any crisis without the risk of bankruptcy. This fact would be attractive to investors looking for a company that is relatively safe, making it a good option for those who are risk-averse. Additionally, RADNET’s moderate level of growth makes it a good potential investment for those who are looking for stability as well as some growth potential. More…
Peers
The company offers a full range of imaging services, including MRI, PET/CT, CT, X-ray, ultrasound, mammography, and nuclear medicine. RadNet has a network of over 250 outpatient imaging centers in 25 states. The company’s competitors include Lantheus Holdings Inc, Todos Medical Ltd, and Medical Imaging Corp. RadNet’s competitive advantage lies in its comprehensive range of services, nationwide footprint, and strong relationships with referring physicians.
– Lantheus Holdings Inc ($NASDAQ:LNTH)
Lantheus Holdings Inc is a holding company that focuses on the development and commercialization of diagnostic and therapeutic imaging agents and products that help healthcare providers improve patient care. It operates through two segments: Diagnostics and Therapeutics. The Diagnostics segment provides products and services for the diagnosis of certain diseases and conditions. The Therapeutics segment provides products and services for the treatment of certain diseases and conditions.
– Todos Medical Ltd ($OTCPK:TOMDF)
Todos Medical Ltd is a biotechnology company that focuses on the development and commercialization of blood tests for the early detection of cancer and other diseases. The company’s market cap is 19.09M as of 2022 and has a Return on Equity of 43.06%. The company’s products are designed to provide accurate and sensitive results that can be used to guide treatment decisions.
– Medical Imaging Corp ($OTCPK:MEDD)
Medical Imaging Corporation is a leading provider of medical imaging solutions. The company offers a full range of medical imaging products and services, including X-ray, MRI, and CT scanners. Medical Imaging Corporation is dedicated to providing the highest quality medical imaging products and services to its customers. The company’s products are used by hospitals, clinics, and physicians around the world.
Summary
Furthermore, the company has seen increasing market capitalization due to its increasing visibility and positive investor sentiment as well as the growing demand for diagnostic imaging services. Moving forward, investors should watch for further updates on the company’s financial performance and developments in the healthcare sector that could impact RadNet‘s business outlook.


Investing Everyone Can Do.
Investing shouldn’t be exclusive to a select few. We believe everyone should have the opportunity to grow their wealth. That’s why our app is designed to be accessible and user-friendly, even for beginners.
