MACY’S Reports FY2023 Q4 Earnings Results After Concluding January 31 2023
March 18, 2023

Earnings Overview
MACY’S ($NYSE:M): MACY’s released its earnings results for the fourth quarter of fiscal year 2023, ending January 31 2023, on March 2 2023. Total revenue for the period amounted to USD 508.0 million, a decrease of 31.5% from the same quarter a year ago. Net income for the quarter was USD 8526.0 million, a decline of 4.5% year-on-year.
Share Price
MACY’S reported its fourth quarter earnings results for the fiscal year ending January 31, 2023, on Thursday. In response to the news, MACY’S stock price opened at $21.6 and closed at $22.7 – a rise of 11.1% from its prior closing price of $20.4. This surge in stock price was fueled by the company’s strong results, which showed significant improvement compared to the previous quarter. This strong performance demonstrates MACY’S ability to adjust their strategy to the ever-changing economic landscape.
Overall, MACY’S reported a positive set of fourth quarter earnings results for FY2023, with strong sales growth, increased net income and EPS. Investors have responded positively to the news and are eagerly awaiting further developments from MACY’S as they continue to adjust their strategy to changing market conditions. Live Quote…
About the Company
Income Snapshot
Below shows the total revenue, net income and net margin for Macy’s. More…
| Total Revenues | Net Income | Net Margin |
| 25.3k | 1.18k | 4.6% |
Cash Flow Snapshot
Below shows the cash from operations, investing and financing for Macy’s. More…
| Operations | Investing | Financing |
| 1.61k | -1.17k | -1.3k |
Balance Sheet Snapshot
Below shows the total assets, liabilities and book value per share for Macy’s. More…
| Total Assets | Total Liabilities | Book Value Per Share |
| 16.87k | 12.78k | 12.81 |
Key Ratios Snapshot
Some of the financial key ratios for Macy’s are shown below. More…
| 3Y Rev Growth | 3Y Operating Profit Growth | Operating Margin |
| -0.0% | 13.1% | 6.6% |
| FCF Margin | ROE | ROA |
| 1.3% | 30.2% | 6.2% |
Analysis
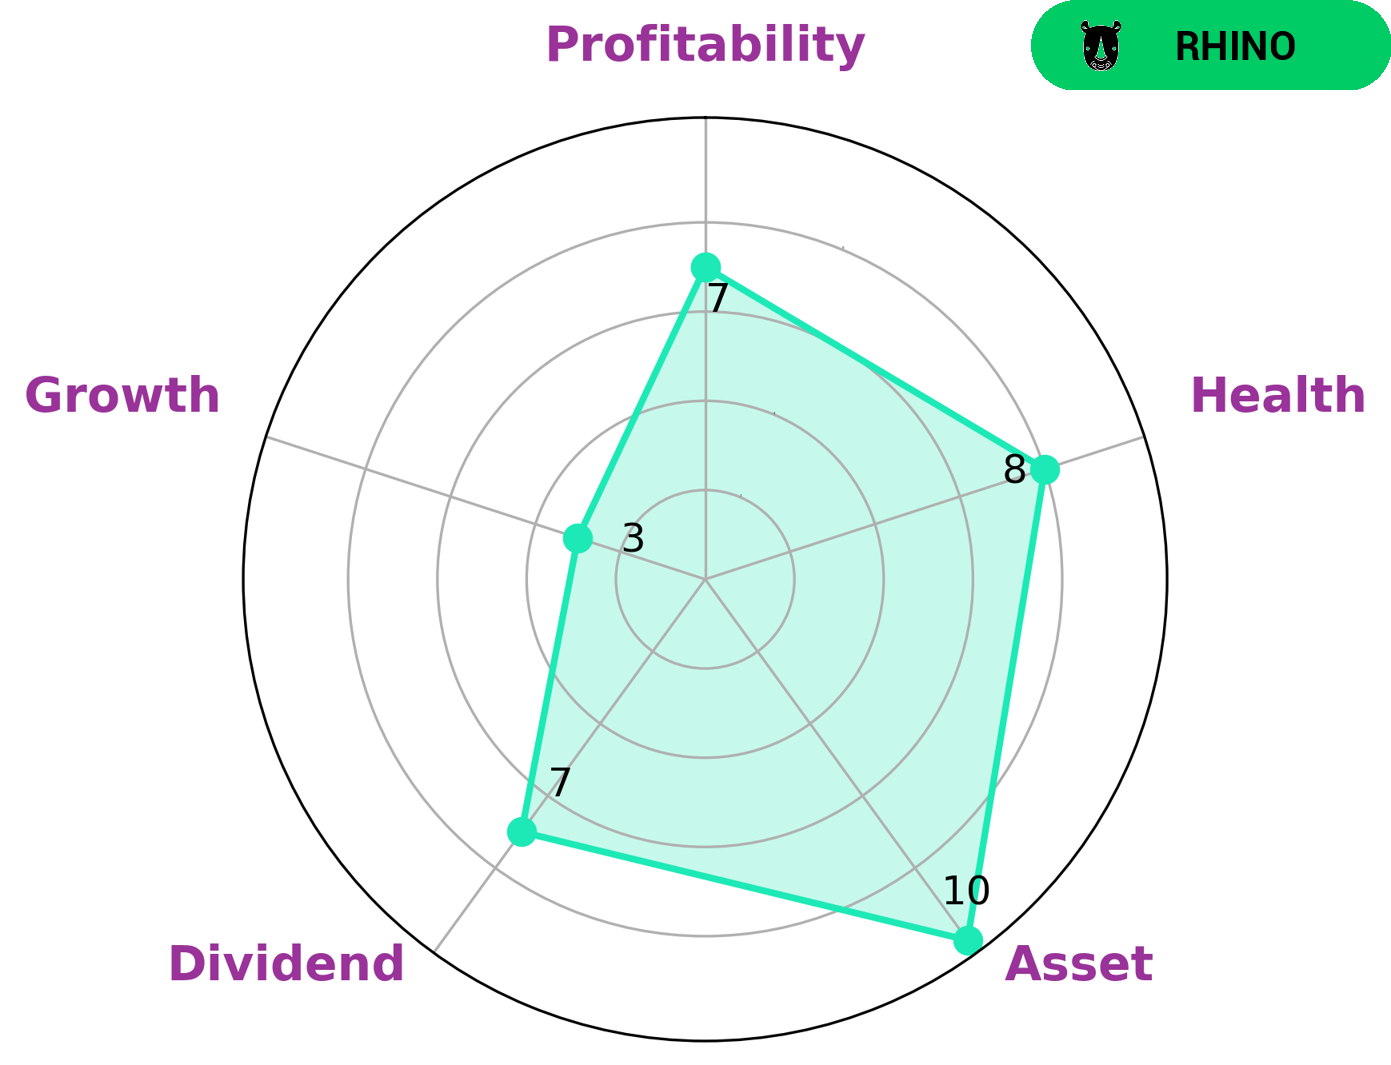
GoodWhale has taken a deep dive into the wellbeing of MACY’S and our initial findings point to it being a strong company. Our Star Chart shows that MACY’S is strong in terms of asset management, dividends, and profitability, while it is weak in terms of growth. Even more encouraging is that our health assessment of MACY’S yields a score of 8/10 with regards to its cashflows and debt. This suggests that MACY’S is capable of paying off debt and funding future operations. Ultimately, GoodWhale classifies MACY’S as a ‘rhino’, a type of company we conclude has achieved moderate revenue or earnings growth. Therefore, value investors that are looking for stability and slow but steady growth may be interested in MACY’S. More…
Peers
Macy’s Inc, World Co Ltd, Kohl’s Corp, and PT Ramayana Lestari Sentosa Tbk are all retail companies.
– World Co Ltd ($TSE:3612)
As of 2022, World Co Ltd has a market cap of 46.04B and a Return on Equity of 4.14%. The company is engaged in the business of providing online services. It offers a range of services, including online search, advertising, maps, software applications, and cloud computing.
– Kohl’s Corp ($NYSE:KSS)
Kohl’s Corp is an American department store retail chain. The company has a market capitalization of $3.56 billion as of 2022 and a return on equity of 16.46%. Kohl’s operates 1,158 stores in 49 states. The company offers a wide variety of merchandise, including apparel, shoes, cosmetics, and home goods. Kohl’s is known for its discount pricing and extensive promotions.
– PT Ramayana Lestari Sentosa Tbk ($IDX:RALS)
Ramayana Lestari Sentosa Tbk is an Indonesian conglomerate with interests in retail, malls, and real estate. The company has a market cap of 3.67 trillion as of 2022 and a return on equity of 6.89%. The company was founded in 1973 and is headquartered in Jakarta, Indonesia.
Summary
Investing analysis of MACY’S reveals a decrease in total revenue of 31.5% year over year for the quarter ending January 31 2023, with net income decreasing 4.5% on the same basis. Despite this, the stock price moved up on March 2 2023 when the earnings results were released, indicating faith in the company’s ability to recover despite the current economic environment. It remains to be seen if this will be maintained in the future and if MACY’S can recoup losses from the previous quarter.
Related Posts


Recent Posts


