DILLARD’S Reports Third Quarter Earnings for FY2024, Ending November 9 2023
November 28, 2023

🌥️Earnings Overview
DILLARD’S ($NYSE:DDS) reported their earnings results for the third quarter of FY2024, ending November 9 2023, on October 31 2023. Total revenue for the quarter amounted to USD 1504.2 million, which was a decrease of 4.4% compared to the same period from the previous year. Net income for the quarter was USD 155.3 million, representing a 17.3% decline year over year.
Share Price
The company’s stock opened at $305.0 and closed at $291.9, marking a decrease of 5.4% from its prior closing price of 308.4. This was a sizable drop from the beginning of the day, which is sure to have been a major disappointment for shareholders. It will be interesting to see how DILLARD’S reacts to this news and if the stock prices can rebound any time soon. Investors should keep a close eye on the company’s financials as well as any further announcements that might have an impact on the stock’s performance. Live Quote…
About the Company
Income Snapshot
Below shows the total revenue, net income and net margin for Dillard’s. More…
| Total Revenues | Net Income | Net Margin |
| 6.88k | 777.49 | 11.1% |
Cash Flow Snapshot
Below shows the cash from operations, investing and financing for Dillard’s. More…
| Operations | Investing | Financing |
| 837.07 | 50.75 | -578.5 |
Balance Sheet Snapshot
Below shows the total assets, liabilities and book value per share for Dillard’s. More…
| Total Assets | Total Liabilities | Book Value Per Share |
| 3.9k | 2.08k | 104.88 |
Key Ratios Snapshot
Some of the financial key ratios for Dillard’s are shown below. More…
| 3Y Rev Growth | 3Y Operating Profit Growth | Operating Margin |
| 12.9% | 88.8% | 14.3% |
| FCF Margin | ROE | ROA |
| 10.3% | 35.9% | 15.8% |
Analysis
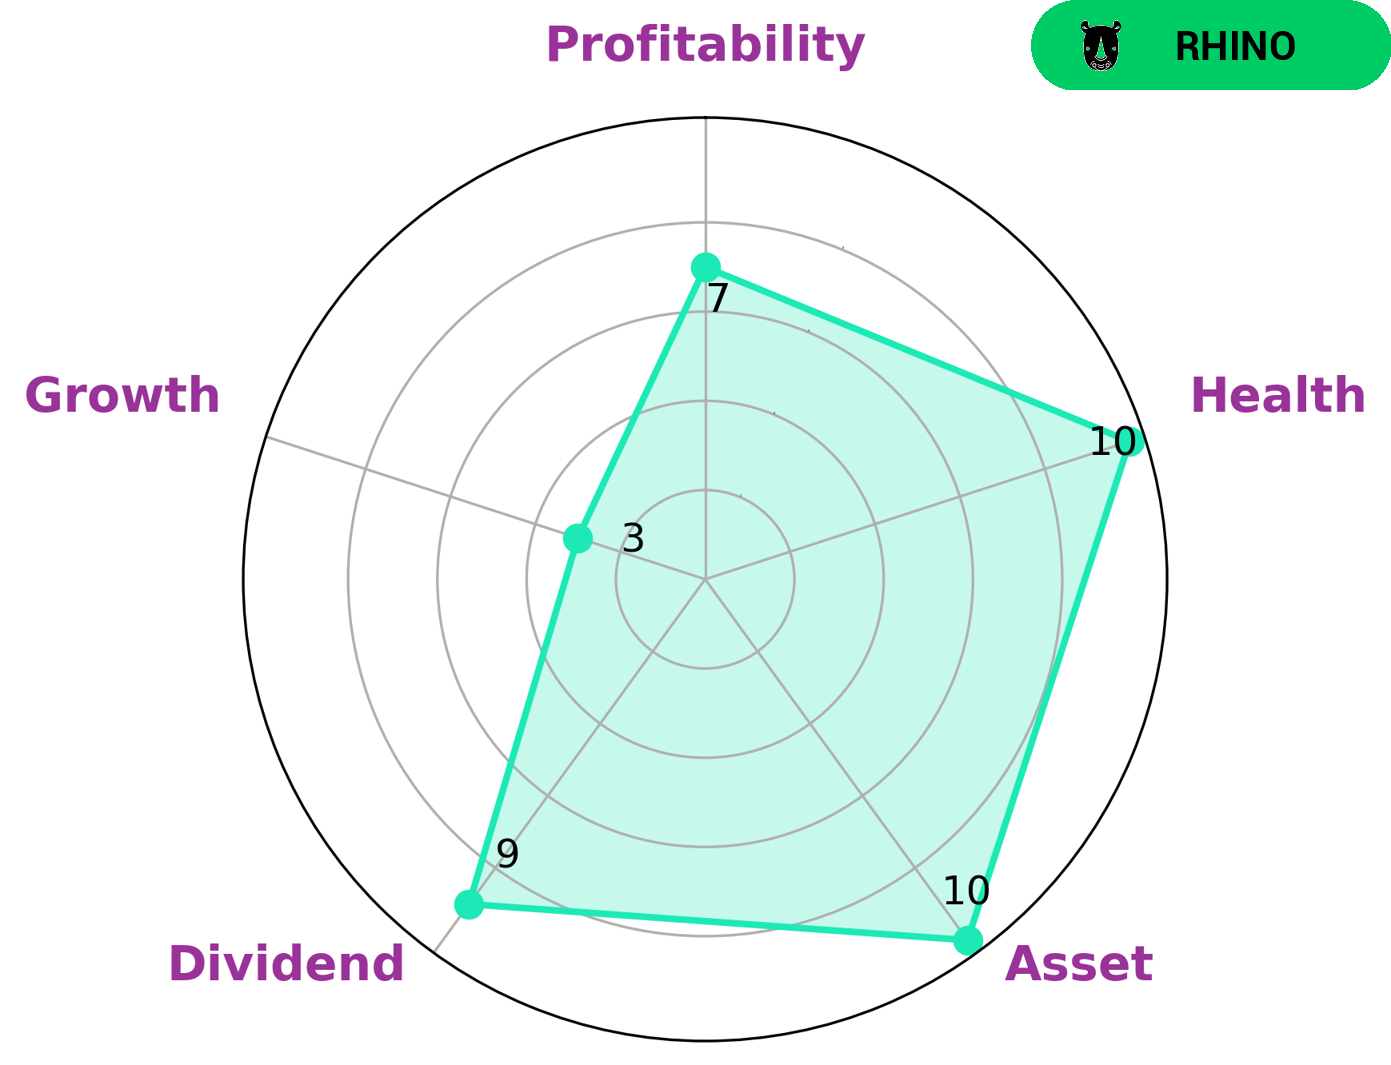
GoodWhale has conducted an analysis of DILLARD’S fundamentals, which reveals that the company is strong in asset, dividend, profitability, and weak in growth. Our Star Chart indicates that DILLARD’S has a high health score of 10/10 considering its cashflows and debt, making it capable to pay off debt and fund future operations. We have classified the company as a ‘rhino’, which implies that it has achieved moderate revenue or earnings growth. Investors who are looking for a steady investment with potential for long-term growth may be interested in DILLARD’S. The company’s strong financials provide assurance of a reliable dividend payment and a stable cash flow. Furthermore, its modest growth rate suggests opportunities for growth over time as the company further builds its brand and expands its offerings. This makes it a potential choice for investors who are seeking to build their portfolio with moderate-growth stocks. More…
Peers
Dillard’s Inc, Macy’s Inc, Nordstrom Inc, and Kohl’s Corp are all in competition with each other. They are all trying to get the customer’s money by offering different products and services.
– Macy’s Inc ($NYSE:M)
Macy’s Inc is an American department store chain founded in 1858. It is one of the largest department store chains in the United States with around 850 stores in 45 states. Macy’s Inc has a market cap of 5.04B as of 2022 and a Return on Equity of 40.81%. The company operates in the Retail industry and its headquarters is in Cincinnati, Ohio.
– Nordstrom Inc ($NYSE:JWN)
Nordstrom is an American luxury fashion retailer founded in 1901. It has a market cap of $3.09B as of 2022 and a Return on Equity of 70.09%. Nordstrom operates in over 38 countries and has over 350 stores across the globe. The company offers a wide range of products and services, including apparel, shoes, handbags, jewelry, and beauty products. Nordstrom also has an e-commerce platform that offers free shipping and returns.
– Kohl’s Corp ($NYSE:KSS)
Kohl’s is a leading retailer that operates more than 1,100 department stores across the United States. The company offers a wide variety of merchandise, including apparel, shoes, and accessories for men, women, and children, as well as home products. Kohl’s also provides exclusive lines from top brands such as Nike, Adidas, and Under Armour. In addition to its retail stores, Kohl’s operates an e-commerce site and a mobile app.
Kohl’s has a market capitalization of 3.3 billion as of 2022 and a return on equity of 16.46%. The company has been in operation for over 50 years and has a strong reputation for providing quality merchandise at competitive prices. Kohl’s is committed to offering an enjoyable shopping experience for its customers and provides a variety of convenient shopping options, such as online and mobile shopping.
Summary
Investors showed disappointment in DILLARD’S third quarter fiscal year 2024 earnings results, as the company reported total revenue of USD 1504.2 million, a decrease of 4.4% year-over-year, and net income of USD 155.3 million, a decline of 17.3% from the same period last year. On October 31 2023, the stock price responded negatively to the news, and investors remain cautious about the future outlook of the company. DILLARD’S must prioritize strategies to improve profits in the upcoming quarters if it wants to remain a viable investment option.
Related Posts


Recent Posts


Investing Everyone Can Do.
Investing shouldn’t be exclusive to a select few. We believe everyone should have the opportunity to grow their wealth. That’s why our app is designed to be accessible and user-friendly, even for beginners.
