DILLARD’S Reports Strong Third Quarter Earnings for FY2024
November 23, 2023

☀️Earnings Overview
On October 31, 2023, DILLARD’S ($NYSE:DDS) reported its earnings for the third quarter of FY2024, which showed total revenue of USD 1504.2 million, a 4.4% decrease from the same period in the previous year. Net income was reported at USD 155.3 million, a 17.3% decrease compared to the same period in the prior year.
Market Price
The stock opened at 305.0 and closed at 291.9, showing a decrease in overall stock value. Despite the decrease, the company reported an increase in sales and profits for the quarter. The strong earnings report comes after the company’s successful strategy of focusing on digital marketing and online sales. DILLARD’S has been able to capitalize on their digital capabilities to reach a wider audience and increase their customer base.
Additionally, the company has invested in technology and automation to improve operational efficiency and reduce costs. These efforts have allowed DILLARD’S to increase sales and profits in the third quarter of FY2024, even despite the stock declining. The company has managed to remain competitive and profitable in the current economic climate. As DILLARD’S continues to focus on developing their digital capabilities and investing in technology, they are well-positioned to continue to post strong earnings in the coming quarters. Live Quote…
About the Company
Income Snapshot
Below shows the total revenue, net income and net margin for Dillard’s. More…
| Total Revenues | Net Income | Net Margin |
| 6.88k | 777.49 | 11.1% |
Cash Flow Snapshot
Below shows the cash from operations, investing and financing for Dillard’s. More…
| Operations | Investing | Financing |
| 837.07 | 50.75 | -578.5 |
Balance Sheet Snapshot
Below shows the total assets, liabilities and book value per share for Dillard’s. More…
| Total Assets | Total Liabilities | Book Value Per Share |
| 3.9k | 2.08k | 104.88 |
Key Ratios Snapshot
Some of the financial key ratios for Dillard’s are shown below. More…
| 3Y Rev Growth | 3Y Operating Profit Growth | Operating Margin |
| 12.9% | 88.8% | 14.3% |
| FCF Margin | ROE | ROA |
| 10.3% | 35.9% | 15.8% |
Analysis
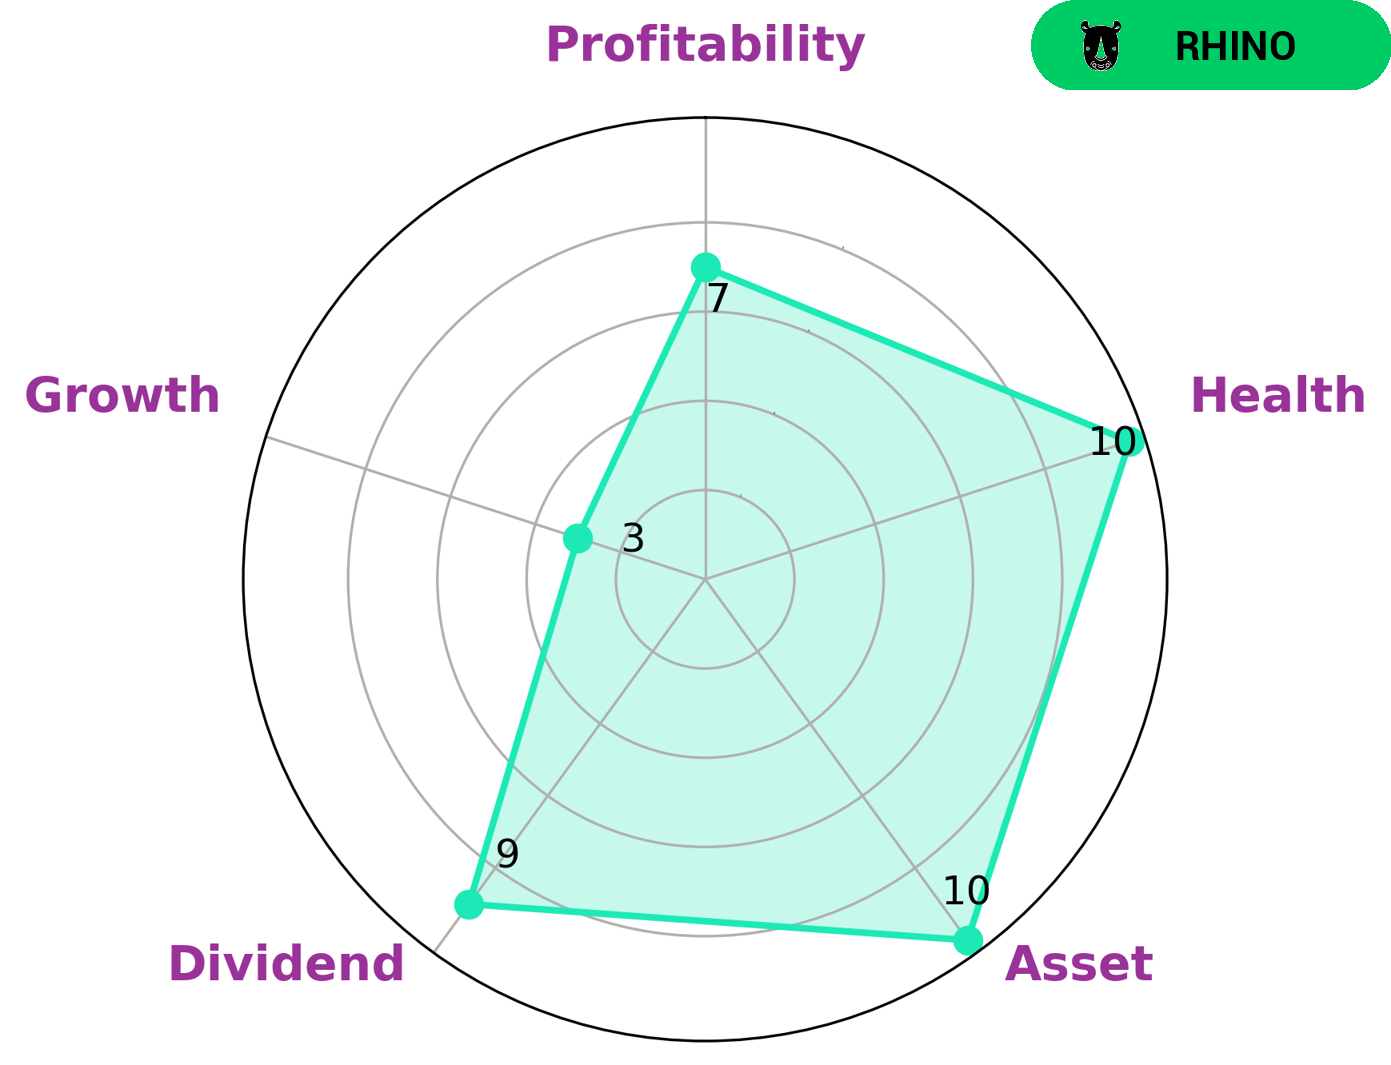
At GoodWhale, we analyzed DILLARD’S finances to provide investors with a better understanding of the company. Using our Star Chart, we found that DILLARD’S was strong in asset, dividend, profitability, and weak in growth. Because of this, we classified DILLARD’S as a ‘rhino’, a type of company that has achieved moderate revenue or earnings growth. This finding could be of interest to investors looking for a stable option with lower volatility. Additionally, DILLARD’S has a high health score of 10/10 based on its cashflows and debt, meaning it is capable of safely riding out any crisis without the risk of bankruptcy. This makes it an attractive option for investors who are looking for stability and security. More…
Peers
Dillard’s Inc, Macy’s Inc, Nordstrom Inc, and Kohl’s Corp are all in competition with each other. They are all trying to get the customer’s money by offering different products and services.
– Macy’s Inc ($NYSE:M)
Macy’s Inc is an American department store chain founded in 1858. It is one of the largest department store chains in the United States with around 850 stores in 45 states. Macy’s Inc has a market cap of 5.04B as of 2022 and a Return on Equity of 40.81%. The company operates in the Retail industry and its headquarters is in Cincinnati, Ohio.
– Nordstrom Inc ($NYSE:JWN)
Nordstrom is an American luxury fashion retailer founded in 1901. It has a market cap of $3.09B as of 2022 and a Return on Equity of 70.09%. Nordstrom operates in over 38 countries and has over 350 stores across the globe. The company offers a wide range of products and services, including apparel, shoes, handbags, jewelry, and beauty products. Nordstrom also has an e-commerce platform that offers free shipping and returns.
– Kohl’s Corp ($NYSE:KSS)
Kohl’s is a leading retailer that operates more than 1,100 department stores across the United States. The company offers a wide variety of merchandise, including apparel, shoes, and accessories for men, women, and children, as well as home products. Kohl’s also provides exclusive lines from top brands such as Nike, Adidas, and Under Armour. In addition to its retail stores, Kohl’s operates an e-commerce site and a mobile app.
Kohl’s has a market capitalization of 3.3 billion as of 2022 and a return on equity of 16.46%. The company has been in operation for over 50 years and has a strong reputation for providing quality merchandise at competitive prices. Kohl’s is committed to offering an enjoyable shopping experience for its customers and provides a variety of convenient shopping options, such as online and mobile shopping.
Summary
DILLARD’S reported their earnings results for the third quarter of FY2024, with total revenue of USD 1504.2 million, a decrease of 4.4% compared to the same period last year. Net income decreased by 17.3%, to USD 155.3 million. On the same day, the stock price dropped.
For investors, this could indicate that DILLARD’S is facing financial difficulties and reduced profitability. It is therefore important to follow the company’s performance more closely to assess whether further investments in the company are warranted.
Related Posts


Recent Posts


Investing Everyone Can Do.
Investing shouldn’t be exclusive to a select few. We believe everyone should have the opportunity to grow their wealth. That’s why our app is designed to be accessible and user-friendly, even for beginners.
