CAPITAL ONE FINANCIAL Reports FY2023 Q2 Earnings Results for June 30 2023
July 26, 2023

🌥️Earnings Overview
On July 20 2023, CAPITAL ONE FINANCIAL ($NYSE:COF) announced the release of their FY2023 Q2 financial results, with total revenue of USD 9.0 billion, up 9.5% from the same period last year. Unfortunately, net income was USD 1.4 billion, a decrease of 29.6% year on year.
Share Price
CAPITAL ONE FINANCIAL reported its earnings results for the second quarter of FY 2023 on Thursday, June 30, 2023. The stock opened at $115.0 and closed at the same price, a decrease of 2.5% from its prior closing price of 118.0. The company showed a decline in its profit during the period, as compared to the previous year. The company attributed this decrease in earnings to an increase in expenses due to higher interest rates and other market factors.
In addition, CAPITAL ONE FINANCIAL continued to face challenges related to the pandemic, which led to a decrease in loan origination and higher delinquency rates. Despite the decrease in earnings, CAPITAL ONE FINANCIAL remained optimistic about its outlook for the rest of the fiscal year. The company announced that it had taken steps to reduce costs and increase profits in order to remain competitive in the current market conditions. In addition, the company stated that it was strengthening its risk management procedures to ensure that it remains on track with its financial goals. Overall, CAPITAL ONE FINANCIAL has taken positive steps to improve its performance and remain competitive in the current economic environment. With its strategies in place, the company is poised to overcome its challenges and return to profitability in the near future. Live Quote…
About the Company
Income Snapshot
Below shows the total revenue, net income and net margin for COF. More…
| Total Revenues | Net Income | Net Margin |
| 35.76k | 5.01k | 15.0% |
Cash Flow Snapshot
Below shows the cash from operations, investing and financing for COF. More…
| Operations | Investing | Financing |
| 16.88k | -29.74k | 25.13k |
Balance Sheet Snapshot
Below shows the total assets, liabilities and book value per share for COF. More…
| Total Assets | Total Liabilities | Book Value Per Share |
| 467.8k | 413.24k | 143.05 |
Key Ratios Snapshot
Some of the financial key ratios for COF are shown below. More…
| 3Y Rev Growth | 3Y Operating Profit Growth | Operating Margin |
| 8.3% | – | – |
| FCF Margin | ROE | ROA |
| 44.6% | 7.6% | 0.9% |
Analysis
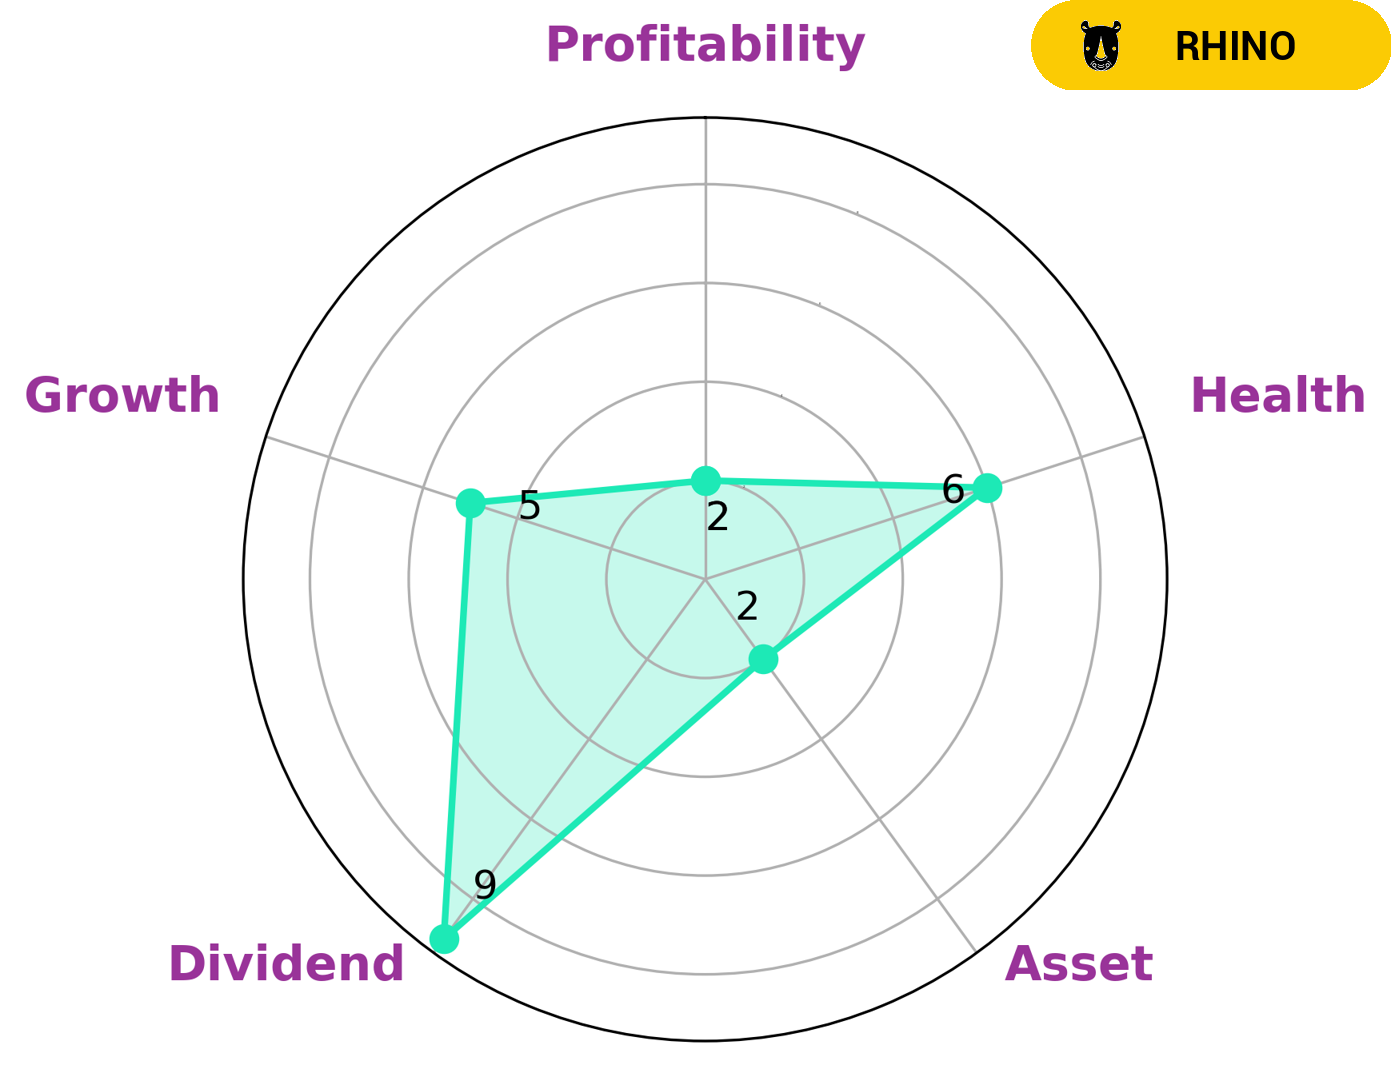
Upon examining CAPITAL ONE FINANCIAL’s financials using GoodWhale’s analysis, we concluded that CAPITAL ONE FINANCIAL has an intermediate health score of 6/10 considering its cashflows and debt, which means that it might be able to safely ride out any crisis without the risk of bankruptcy. On the Star Chart, we observed that CAPITAL ONE FINANCIAL is strong in dividend, medium in growth and weak in asset, profitability. Therefore, we classified CAPITAL ONE FINANCIAL as a ‘cheetah’ company, a type of company that achieved high revenue or earnings growth but is considered less stable due to lower profitability. Investors who are looking to take on higher risks for potential higher returns may be interested in this type of company. Those who are more conservative investors may want to look for different investment opportunities. More…
Peers
In the financial world, competition is fierce. Capital One Financial Corp is up against some tough competition from Hanhua Financial Holding Co Ltd, Oportun Financial Corp, and Jianpu Technology Inc. All of these companies are fighting for a piece of the pie, and they are all hoping to come out on top. Capital One has been a top player in the financial game for a while now, but its competitors are quickly catching up. It will be interesting to see how this competition plays out in the coming years.
– Hanhua Financial Holding Co Ltd ($SEHK:03903)
Hanhua Financial Holding Co Ltd has a market cap of 1.29B as of 2022, a Return on Equity of 0.78%. The company operates in the financial services industry in China, providing banking and other financial services to corporate and individual customers.
– Oportun Financial Corp ($NASDAQ:OPRT)
Oportun Financial is a publicly traded company with a market capitalization of 164.64 million as of 2022. The company has a return on equity of 9.05%. Oportun Financial is a provider of financial services to underserved consumers and small businesses in the United States. The company offers unsecured personal loans, small business loans, and related products and services.
– Jianpu Technology Inc ($NYSE:JT)
Jianpu Technology Inc is a Chinese internet company that provides an online platform for users to find and compare credit products. As of 2022, the company had a market cap of 33.89 million and a return on equity of -35.21%. The company’s platform offers users access to credit products from a variety of financial institutions, including banks, credit card companies, and online lenders.
Summary
Investors in Capital One Financial have cause to be concerned with the company’s second quarter earnings results for FY2023. Despite revenue increasing by 9.5%, net income dropped by an alarming 29.6%. This could signal that the company is struggling to bring in sufficient profits, and further scrutiny is needed to understand the underlying reasons. Investors should take a closer look at the company’s performance and weigh the risk of investing against potential returns.
Related Posts


Recent Posts


Investing Everyone Can Do.
Investing shouldn’t be exclusive to a select few. We believe everyone should have the opportunity to grow their wealth. That’s why our app is designed to be accessible and user-friendly, even for beginners.
