Rcm Technologies Intrinsic Value Calculator – RCM TECHNOLOGIES Reports Earnings for Q1 of FY2023 Ending May 9th, 2023
May 31, 2023

🌥️Earnings Overview
RCM TECHNOLOGIES ($NASDAQ:RCMT) reported earnings results for the first quarter of FY2023, which ended on May 9 2023, on March 31 of that year. The company saw a total revenue of USD 67.1 million, a 18.1% decline from the same period of the previous year, and a net income of USD 3.8 million, a 41.1% drop from the same period the year prior.
Share Price
On Tuesday, RCM TECHNOLOGIES reported their first quarter earnings for the fiscal year 2023 ending May 9th, 2023. Shares of the company opened at $12.3 and closed at $12.4, a positive gain of 1.3% from their last closing price of 12.2. Despite the challenges caused by the pandemic, RCM TECHNOLOGIES has continued to focus on improving customer service and finding ways to reduce costs. This strategy has resulted in improved efficiency and an increase in profit margins. As a result, investors have responded positively to the news, sending the stock up by 1.3%.
Overall, RCM TECHNOLOGIES’s earnings report has been well-received by investors and analysts alike. The company’s ability to remain profitable despite the challenging economic environment is a testament to its resilience and its commitment to delivering value to its shareholders. As the company continues to focus on innovation and customer service, investors can expect to see continued growth in the coming quarters. Live Quote…
About the Company
Income Snapshot
Below shows the total revenue, net income and net margin for Rcm Technologies. More…
| Total Revenues | Net Income | Net Margin |
| 269.84 | 18.21 | 6.6% |
Cash Flow Snapshot
Below shows the cash from operations, investing and financing for Rcm Technologies. More…
| Operations | Investing | Financing |
| 24.98 | -4.93 | -19.1 |
Balance Sheet Snapshot
Below shows the total assets, liabilities and book value per share for Rcm Technologies. More…
| Total Assets | Total Liabilities | Book Value Per Share |
| 97.53 | 69.02 | 3.53 |
Key Ratios Snapshot
Some of the financial key ratios for Rcm Technologies are shown below. More…
| 3Y Rev Growth | 3Y Operating Profit Growth | Operating Margin |
| 13.5% | 68.4% | 9.4% |
| FCF Margin | ROE | ROA |
| 8.9% | 49.7% | 16.3% |
Analysis – Rcm Technologies Intrinsic Value Calculator
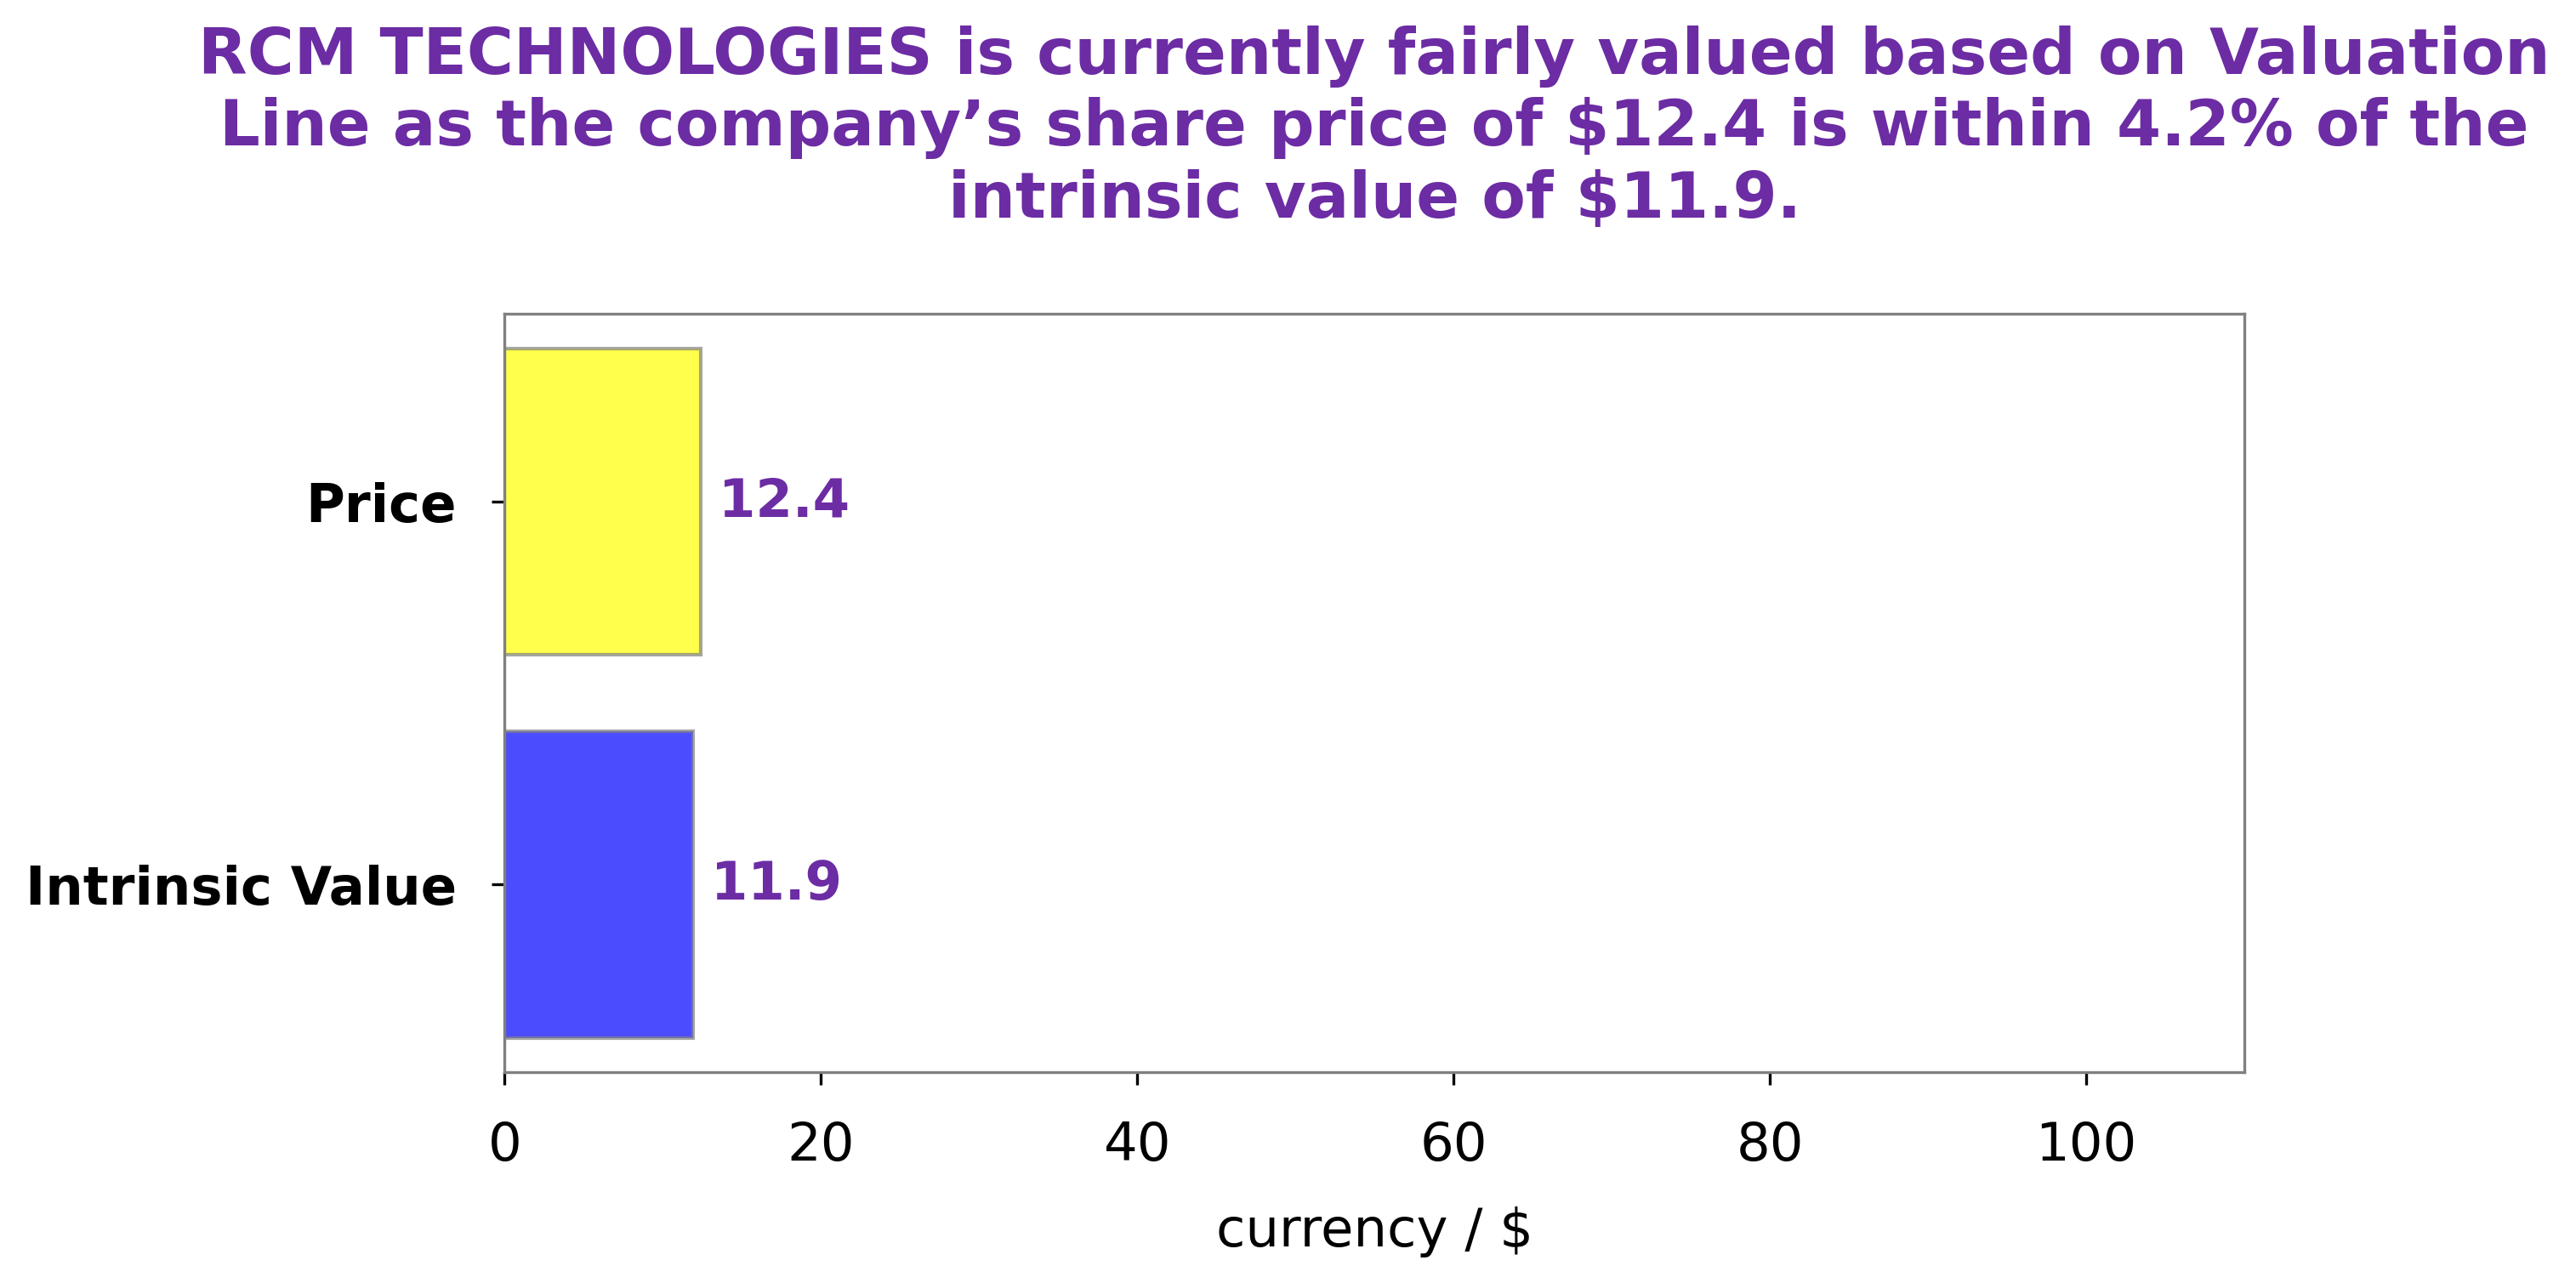
At GoodWhale, we conducted an analysis of RCM TECHNOLOGIES‘ wellbeing. According to our proprietary Valuation Line, the fair value of RCM TECHNOLOGIES’ share is around $11.9. It is important to be aware of such discrepancies in order to make an informed decision when investing. More…
Peers
The company has a strong presence in North America, Europe, and Asia. RCM Technologies Inc’s competitors include Jangho Group Co Ltd, Calian Group Ltd, and Peoplein Ltd.
– Jangho Group Co Ltd ($SHSE:601886)
JHG is a leading investment company with a focus on the healthcare sector. The company has a market capitalization of 8.92 billion as of 2022 and a return on equity of -9.2%. JHG has a diversified portfolio of healthcare investments, including hospitals, clinics, and nursing homes. The company also has a significant presence in the pharmaceutical and biotechnology industries.
– Calian Group Ltd ($TSX:CGY)
Calian Group Ltd is a Canadian professional services company with over 30 years of experience in the provision of health, training, and technology solutions. The company has a market cap of 648.65M as of 2022 and a Return on Equity of 4.41%. Calian employs over 2,600 people in Canada, the United States, and the United Kingdom. The company’s health solutions include primary care, health promotion, and disease prevention services. Calian’s training solutions include online and classroom training, as well as simulation-based training. The company’s technology solutions include systems engineering, software development, and network integration services.
– Peoplein Ltd ($ASX:PPE)
As of 2022, Peoplein Ltd has a market cap of 310.55M and a Return on Equity of 13.79%. The company is a provider of human resources solutions and services.
Summary
RCM TECHNOLOGIES reported their financial results for the first quarter of FY2023, ending May 9 2023. Total revenue for the quarter was USD 67.1 million, a decrease of 18.1% from the same period in the previous year. Net income for the quarter decreased 41.1% year-over-year to USD 3.8 million. Investors should consider the company’s declining revenue and net income as well as other factors when analyzing potential investments in RCM TECHNOLOGIES. This includes evaluating their financial stability, market conditions, and corporate strategies.
Additionally, investors may want to compare RCM TECHNOLOGIES’ performance to its peers in the industry in order to fully assess investment potential.


