Semba Tohka Industries dividend yield calculator – Semba Tohka Industries Co. Ltd Announces 15.0 Cash Dividend
March 19, 2023

Dividends Yield
On March 2 2023, Semba Tohka Industries ($TSE:2916) Co. Ltd has announced a 15.0 JPY cash dividend per share. This is the third consecutive year in which the company has issued an annual dividend of 15.0 JPY per share. This dividend yields for 2021, 2022, and 2023 are respectively estimated to be 2.34%, 2.34% and 2.05%, making the average yield 2.24%. By taking into account this announcement, investors may want to consider SEMBA TOHKA INDUSTRIES as a possible investment option; the ex-dividend date is March 30 2023.
Therefore, the dividend might be an attractive option to those who are aiming at gaining return from stock investments. SEMBA TOHKA INDUSTRIES is a trusted company in Japan and its potential growth means that investing in their stocks could be beneficial for investors for both long-term and short-term gains.
Stock Price
Shares of the company opened at JP¥645.0 and closed at JP¥642.0, representing a 1.2% decline from the previous closing price of 650.0. This announcement marks the latest in the company’s ongoing efforts to reward shareholders through cash dividends. The announcement is expected to be welcomed by investors and could potentially signal a positive outlook for the company’s future performance. Live Quote…
About the Company
Income Snapshot
Below shows the total revenue, net income and net margin for Semba Tohka Industries. More…
| Total Revenues | Net Income | Net Margin |
| 18.37k | 508.26 | 3.0% |
Cash Flow Snapshot
Below shows the cash from operations, investing and financing for Semba Tohka Industries. More…
| Operations | Investing | Financing |
| 1.29k | -996.83 | -797.09 |
Balance Sheet Snapshot
Below shows the total assets, liabilities and book value per share for Semba Tohka Industries. More…
| Total Assets | Total Liabilities | Book Value Per Share |
| 23.15k | 11.21k | 973.57 |
Key Ratios Snapshot
Some of the financial key ratios for Semba Tohka Industries are shown below. More…
| 3Y Rev Growth | 3Y Operating Profit Growth | Operating Margin |
| -3.6% | -28.7% | 4.0% |
| FCF Margin | ROE | ROA |
| 3.4% | 4.1% | 2.0% |
Analysis
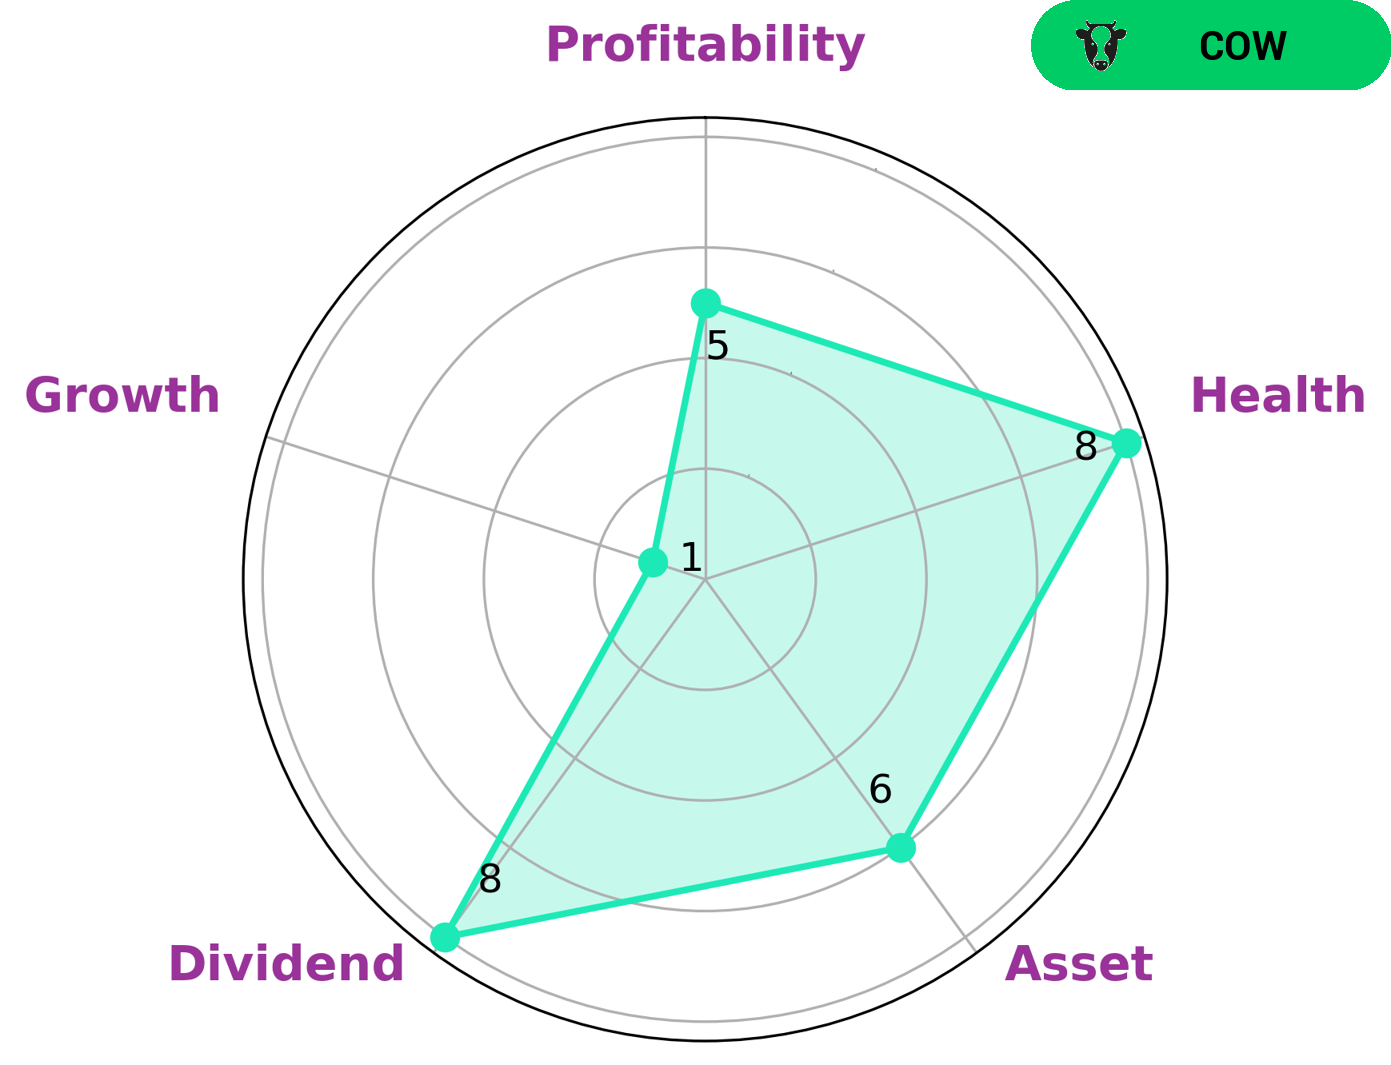
GoodWhale analyzed SEMBA TOHKA INDUSTRIES’ financials and found that it has a high health score of 8/10 with regard to its cashflows and debt, meaning that the company is capable to safely ride out any crisis without the risk of bankruptcy. We further evaluated its performance using the Star Chart and identified that SEMBA TOHKA INDUSTRIES is strong in the dividend department, but medium in asset, profitability and growth. Based on this assessment, we classify SEMBA TOHKA INDUSTRIES as a ‘cow’, a type of company that has the track record of paying out consistent and sustainable dividends. Investors looking for a safe and reliable source of dividend income would be interested in this type of company. Those investors may be retirement savers, income investors, or those looking to diversify away from growth-only companies. As a ‘cow’ company, SEMBA TOHKA INDUSTRIES is considered a low to medium risk investment opportunity with a steady source of income. More…
Peers
The company specializes in manufacturing and marketing a variety of food and beverage items, including dairy products, juices, snacks, and energy drinks. The company competes in the market with companies such as Shinobu Foods Products Co Ltd, TDH Holdings Inc, and Fruitas Holdings Inc. Each of these companies offers a unique range of products and has its own strategies to reach more customers.
– Shinobu Foods Products Co Ltd ($TSE:2903)
Shinobu Foods Products Co Ltd is a leading international food and beverage company known for its high quality products and innovative production processes. It has a market cap of 8.86B as of 2023, which is indicative of the company’s strong financial performance in recent years. In addition to this, the Return on Equity (ROE) of 7.33% signals that the company is efficiently using its resources to generate long-term profits. The company specializes in producing a wide range of food products, including snacks, desserts, beverages, processed meats and sauces.
– TDH Holdings Inc ($NASDAQ:PETZ)
TDH Holdings Inc is a financial services company that provides asset management, insurance, and wealth management services for individuals, families, businesses, and other organizations. It has a market capitalization of 12.65 million dollars as of 2023, which indicates the total value of the company’s outstanding shares. Additionally, its Return on Equity (ROE) is -29.24%, which suggests that the company has not been able to generate a positive return on its shareholders’ investments. This low ROE indicates that the company is likely not performing well financially, given the current market conditions.
– Fruitas Holdings Inc ($PSE:FRUIT)
Fruitas Holdings Inc is a food and beverages company based in the Philippines. It is a publicly traded company listed on the Philippine Stock Exchange and has a market capitalization of 2.67B as of 2023. This represents the total market value of the company’s outstanding shares and is an indication of the company’s size and strength. The Return on Equity (ROE) of 3.56% reflects how efficiently the company is using its equity to generate profits and is seen as a measure of financial performance. The company is best known for its extensive network of kiosks and stores throughout the Philippines, serving a wide range of products such as fruit shakes, smoothies, and ice cream.
Summary
SEMBA TOHKA INDUSTRIES has been issuing an annual dividend per share of 15.0 JPY for the last three years. Investors who consider the company for their portfolio can expect to receive a dividend yield of 2.34% in 2021, 2.34% in 2022, and 2.05% in 2023, giving an average yield of 2.24%. The company may be a good choice for investors looking to bring in a steady stream of income and build wealth over time, as it provides a relatively consistent return each year. However, investors should also consider the company’s overall financial health, any potential risks, and the current market conditions to ensure the dividend yield is worth the potential risk.
Related Posts


Recent Posts


