STRATASYS LTD Reports Earnings Results for Q1 FY2023 Ended March 31 2023
May 31, 2023

🌥️Earnings Overview
On May 16 2023, STRATASYS LTD ($NASDAQ:SSYS) reported their first quarter of FY2023 earnings results, ending on March 31 2023. In comparison to the same quarter in the previous year, the company’s total revenue decreased 8.6%, to USD 149.4 million, and their net income totalled USD -22.2 million, a decrease from -21.0 million in the prior year.
Price History
On Tuesday, STRATASYS LTD reported their earnings results for the first quarter of FY2023 ended March 31 2023. The company saw an impressive 9.7% increase in their stock from the prior closing price of 14.4, with the stock opening at $15.2 and closing at $15.8. This gain is indicative of the success of the company’s dedication to developing innovative 3D printing technology and bringing quality products to market. This increase reflects the company’s commitment to reducing costs and increasing efficiency across their entire organization.
Overall, STRATASYS LTD reported strong earnings results for the first quarter of FY2023. The impressive 9.7% stock gain demonstrates investor confidence in the company’s ability to continue developing innovative 3D printing technology. As the company continues to grow, investors can expect to see more positive results in the future. Live Quote…
About the Company
Income Snapshot
Below shows the total revenue, net income and net margin for Stratasys Ltd. More…
| Total Revenues | Net Income | Net Margin |
| 637.43 | -30.25 | -8.4% |
Cash Flow Snapshot
Below shows the cash from operations, investing and financing for Stratasys Ltd. More…
| Operations | Investing | Financing |
| -75.41 | -7.21 | -2.77 |
Balance Sheet Snapshot
Below shows the total assets, liabilities and book value per share for Stratasys Ltd. More…
| Total Assets | Total Liabilities | Book Value Per Share |
| 1.24k | 292.63 | 13.87 |
Key Ratios Snapshot
Some of the financial key ratios for Stratasys Ltd are shown below. More…
| 3Y Rev Growth | 3Y Operating Profit Growth | Operating Margin |
| 1.3% | – | -8.5% |
| FCF Margin | ROE | ROA |
| -14.9% | -3.6% | -2.7% |
Analysis
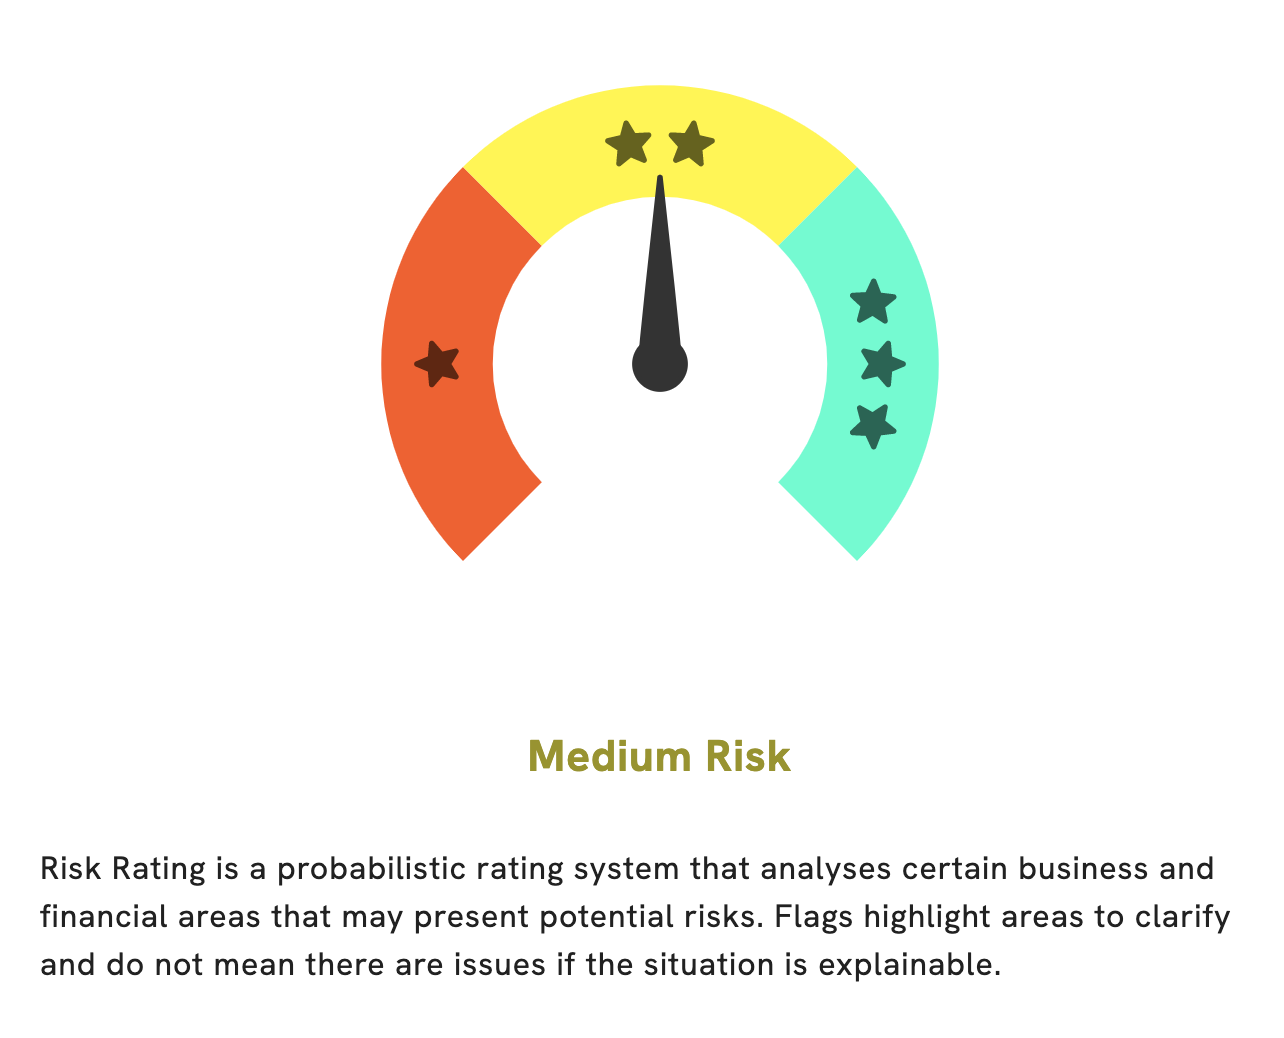
At GoodWhale, we conducted an analysis of STRATASYS LTD‘s financials and have concluded that it is a medium risk investment in terms of both financial and business aspects. We have identified two risk warnings in their income sheet and balance sheet however, so if you’re considering investing in this company, make sure to register with us for more detailed information. We evaluated the company’s assets, liabilities, cash flow, profitability, and other relevant financial indicators to come to our conclusion. In addition, we also considered the company’s management, customer base, competitive landscape, and other business-related aspects. While we believe STRATASYS LTD to be a solid investment overall, it is still important to be mindful of the two risk warnings that we have identified. We believe that knowledge is power, and that’s why GoodWhale is here to provide investors with reliable information and insights. Register with us to learn more about the risk warnings surrounding STRATASYS LTD’s financials and make an informed decision about investing in this company. More…
Peers
The company’s products are used in a variety of industries, including aerospace, automotive, healthcare, and consumer products. Stratasys Ltd has a wide range of competitors, including WEP Solutions Ltd, MGI Digital Graphic Technology SA, and HiTi Digital Inc.
– WEP Solutions Ltd ($BSE:532373)
WEP Solutions Ltd is an information technology company that provides a range of services, including software development, enterprise resource planning, and cloud computing. The company has a market cap of 839.61M as of 2022 and a Return on Equity of 6.32%.
– MGI Digital Graphic Technology SA ($OTCPK:FRIIF)
MGI Digital Graphic Technology SA is a Swiss manufacturer of digital printing and finishing solutions for the graphic arts industry. The company has a market capitalization of 184.68 million as of 2022 and a return on equity of 4.79%. MGI Digital Graphic Technology SA designs, manufactures, and markets a range of digital printing and finishing solutions, including printers, print heads, inks, and software. The company’s products are used in a variety of applications, such as signage, packaging, labels, and commercial printing.
– HiTi Digital Inc ($TWSE:3494)
HiTi Digital Inc is a publicly traded company with a market cap of 1B as of 2022. The company has a Return on Equity of -23.92%. HiTi Digital Inc is engaged in the business of digital textile printing, photo printing, and ID card printing.
Summary
STRATASYS LTD reported their first quarter FY2023 earnings results on May 16 2023, showing total revenue of USD 149.4 million and net income of USD -22.2 million. Compared to the same quarter in the prior year, total revenue decreased by 8.6% and net income declined from -21.0 million. The stock price moved up on the day of the report. As such, investors may consider this as a potential buying opportunity due to the company’s current discounted valuation relative to its long-term growth potential.
In addition, investors should closely monitor any changes in the company’s financial performance and outlook in order to make more informed investment decisions.
Related Posts


Recent Posts


Investing Everyone Can Do.
Investing shouldn’t be exclusive to a select few. We believe everyone should have the opportunity to grow their wealth. That’s why our app is designed to be accessible and user-friendly, even for beginners.
