CELANESE CORPORATION Reports Q3 FY2023 Earnings Results on November 6, 2023
December 1, 2023

🌥️Earnings Overview
On November 6 2023, CELANESE CORPORATION ($NYSE:CE) released its financial results for Q3 of FY2023, which ended on September 30 2023. The reported total revenue for the quarter was USD 2723.0 million, representing an 18.3% increase from the same quarter the previous year. Net income for the quarter was USD 951.0 million, significantly higher than the result of USD 191.0 million from the previous year.
Market Price
On Monday, November 6th, 2023, CELANESE CORPORATION reported its Q3 earnings results for FY2023. The stock opened at $121.1 and by the end of the trading day it had closed at $120.0, a decrease of 0.8% from its previous closing price of $121.0.
Additionally, the company saw an impressive return on equity of 30%. Despite these strong financials, the stock price took a slight dip, however CELANESE CORPORATION’s CEO, Kenneth Tsang, remained confident in the company’s performance. He stated that they were pleased with their current performance and saw the potential for further growth in the future. Overall, CELANESE CORPORATION had a successful Q3 as they beat expectations and achieved strong returns on equity. With their current momentum, it seems that investors can expect to see the stock price continue to rise in the future. Live Quote…
About the Company
Income Snapshot
Below shows the total revenue, net income and net margin for Celanese Corporation. More…
| Total Revenues | Net Income | Net Margin |
| 10.72k | 2.03k | 14.5% |
Cash Flow Snapshot
Below shows the cash from operations, investing and financing for Celanese Corporation. More…
| Operations | Investing | Financing |
| 1.61k | -10.68k | 728 |
Balance Sheet Snapshot
Below shows the total assets, liabilities and book value per share for Celanese Corporation. More…
| Total Assets | Total Liabilities | Book Value Per Share |
| 25.54k | 18.59k | 59.63 |
Key Ratios Snapshot
Some of the financial key ratios for Celanese Corporation are shown below. More…
| 3Y Rev Growth | 3Y Operating Profit Growth | Operating Margin |
| 24.9% | 14.1% | 15.8% |
| FCF Margin | ROE | ROA |
| 9.6% | 17.4% | 4.1% |
Analysis
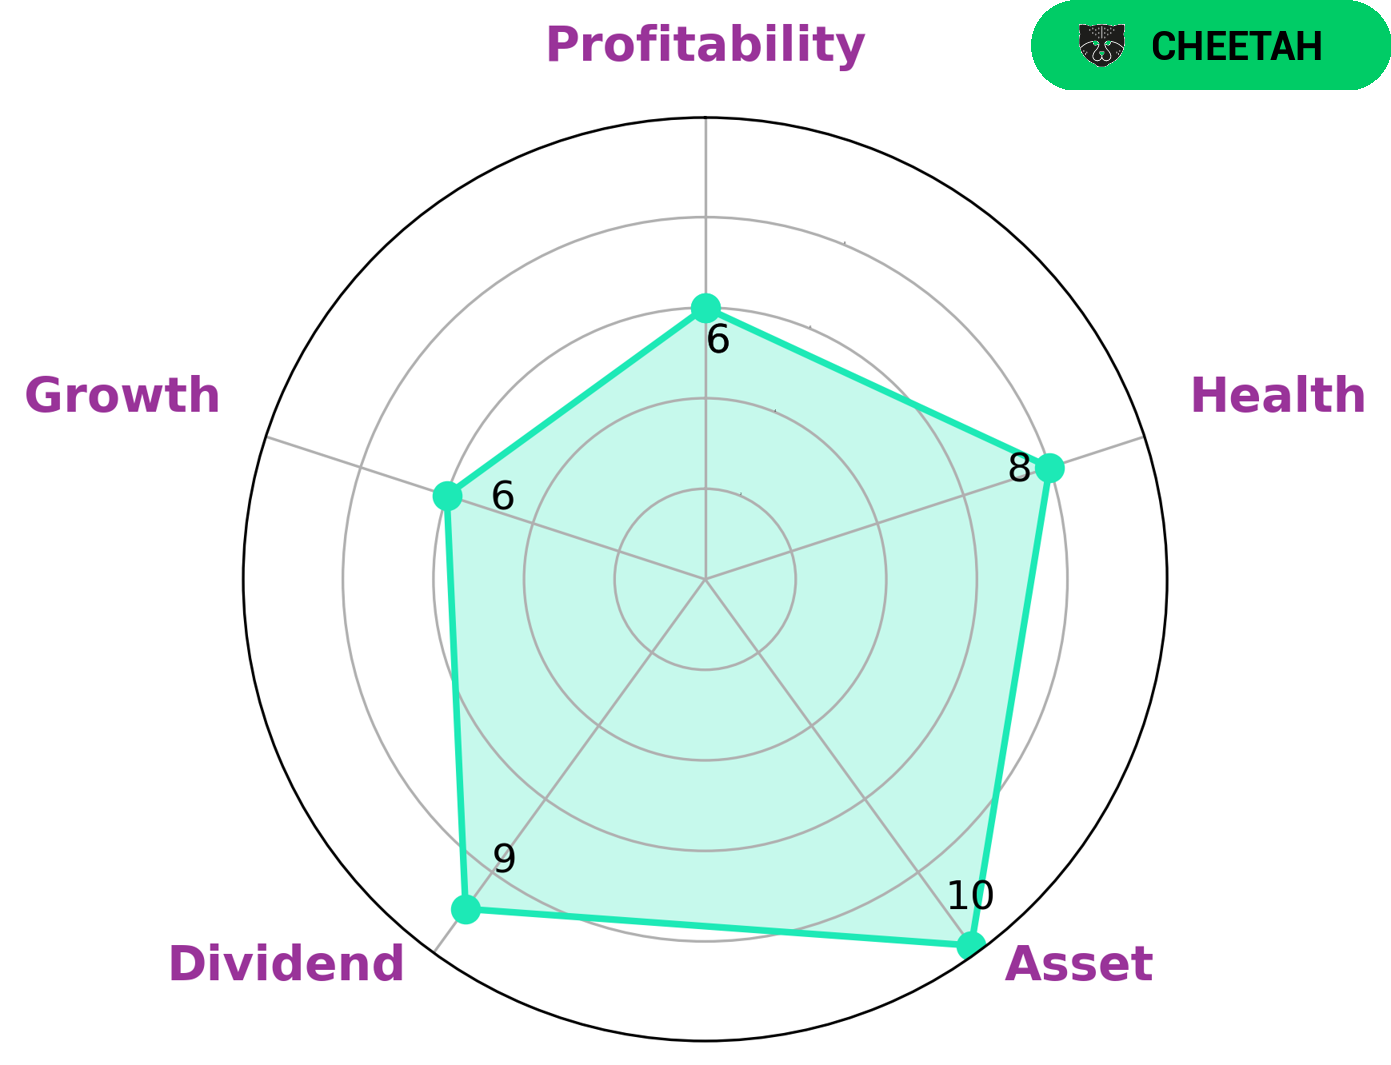
GoodWhale has conducted an analysis of CELANESE CORPORATION‘s wellbeing to determine its overall financial health. Looking at the Star Chart, CELANESE CORPORATION has scored very highly with an 8/10 in terms of its cashflow and debt. This indicates that it is able to safely ride out any crisis without the risk of bankruptcy. In terms of its asset, dividend and growth, CELANESE CORPORATION scores strongly, and it even scores medium in terms of profitability. From this we have classified it as a ‘cheetah’ – a company that has achieved high revenue or earnings growth but is considered less stable due to lower profitability. Given this information, investors that have a higher appetite for risk may be interested in such a company, as it offers the potential for higher returns. Investors seeking more stability may prefer to look elsewhere as they may not be comfortable with its lower levels of profitability. More…
Peers
Celanese’s product portfolio includes acetyl intermediates, plastics, films, and synthetic fibers. The company operates in two segments: Advanced Engineered Materials and Industrial Specialties. Celanese’s competitors include Dow Inc, DuPont de Nemours Inc, and Showa Denko KK.
– Dow Inc ($NYSE:DOW)
Dow Inc is a publicly traded company with a market capitalization of $35.24 billion as of 2022. The company’s return on equity is 26.96%. Dow Inc is a diversified chemical company that produces and sells chemicals, plastics, and agricultural products. The company operates in more than 80 countries and employs approximately 36,000 people.
– DuPont de Nemours Inc ($NYSE:DD)
DuPont de Nemours Inc is a large chemical company with a market cap of 34.47B as of 2022. The company has a ROE of 6.8%. DuPont is a science company that delivers science-based solutions to make people’s lives better, healthier and safer.
– Showa Denko KK ($TSE:4004)
Show Denko KK is a Japanese company that manufactures and sells chemicals and materials. The company has a market capitalization of 406.88 billion as of 2022 and a return on equity of 7.29%. Showa Denko is a diversified company with businesses ranging from petrochemicals to electronics. The company is one of the largest producers of aluminum oxide in the world and also produces and sells a variety of other chemicals and materials.
Summary
CELANESE CORPORATION has seen a strong financial performance in the third quarter of FY2023, with total revenue of USD 2723 million, an increase of 18.3%. Net income of USD 951 million was significantly higher than the same quarter last year, indicating strong profitability. This is a positive signal for investors, as it indicates the company’s ability to generate returns and manage its expenses. With growing revenue and high net income, CELANESE CORPORATION is an attractive investment for those looking to diversify their portfolios.
Related Posts


Recent Posts


Investing Everyone Can Do.
Investing shouldn’t be exclusive to a select few. We believe everyone should have the opportunity to grow their wealth. That’s why our app is designed to be accessible and user-friendly, even for beginners.
