Trane Technologies’ Non-GAAP EPS & Revenue Beat Expectations by $0.07 & $20M Respectively
May 4, 2023

Trending News ☀️
Trane Technologies ($NYSE:TT) has been making headlines recently as its Non-GAAP Earnings Per Share (EPS) and revenue have exceeded expectations. Trane Technologies is a leading global provider of heating, ventilation, and air conditioning (HVAC) systems and services that improve indoor air quality and comfort. It provides innovative solutions to improve efficiency, reduce energy consumption, and maximize comfort in residential, commercial, and industrial buildings. Its portfolio of products and services includes air conditioners, furnaces, air handlers, heat pumps, fan coils, air purification products and accessories, temperature controls, and building automation systems.
Additionally, Trane Technologies offers installation and maintenance services for its products. It serves customers in the United States, Canada, Latin America, Europe, Middle East, Africa and Asia Pacific.
Earnings
TRANE TECHNOLOGIES recently released its earning report for FY2022 Q4 ending December 31 2022, and the results were quite impressive. Compared to the same quarter from the previous year, this is a 14.1% increase in total revenue and a 38.2% increase in net income. In terms of non-GAAP earnings per share, TRANE TECHNOLOGIES exceeded expectations by $0.07. All in all, TRANE TECHNOLOGIES had a very successful quarter and the future looks very promising.
About the Company
Income Snapshot
Below shows the total revenue, net income and net margin for Trane Technologies. More…
| Total Revenues | Net Income | Net Margin |
| 15.99k | 1.76k | 11.2% |
Cash Flow Snapshot
Below shows the cash from operations, investing and financing for Trane Technologies. More…
| Operations | Investing | Financing |
| 1.5k | -540.4 | -1.85k |
Balance Sheet Snapshot
Below shows the total assets, liabilities and book value per share for Trane Technologies. More…
| Total Assets | Total Liabilities | Book Value Per Share |
| 18.08k | 11.98k | 26.61 |
Key Ratios Snapshot
Some of the financial key ratios for Trane Technologies are shown below. More…
| 3Y Rev Growth | 3Y Operating Profit Growth | Operating Margin |
| -1.2% | 6.2% | 15.0% |
| FCF Margin | ROE | ROA |
| 7.6% | 25.1% | 8.3% |
Stock Price
Despite these positive figures, TRANE TECHNOLOGIES’ stock opened at $187.0 and closed at $177.7, a decrease of 5.7% from its prior closing price of 188.6. The company attributed this discrepancy to the lowered expectations of its Industrial business segment during the upcoming quarters. Live Quote…
Analysis
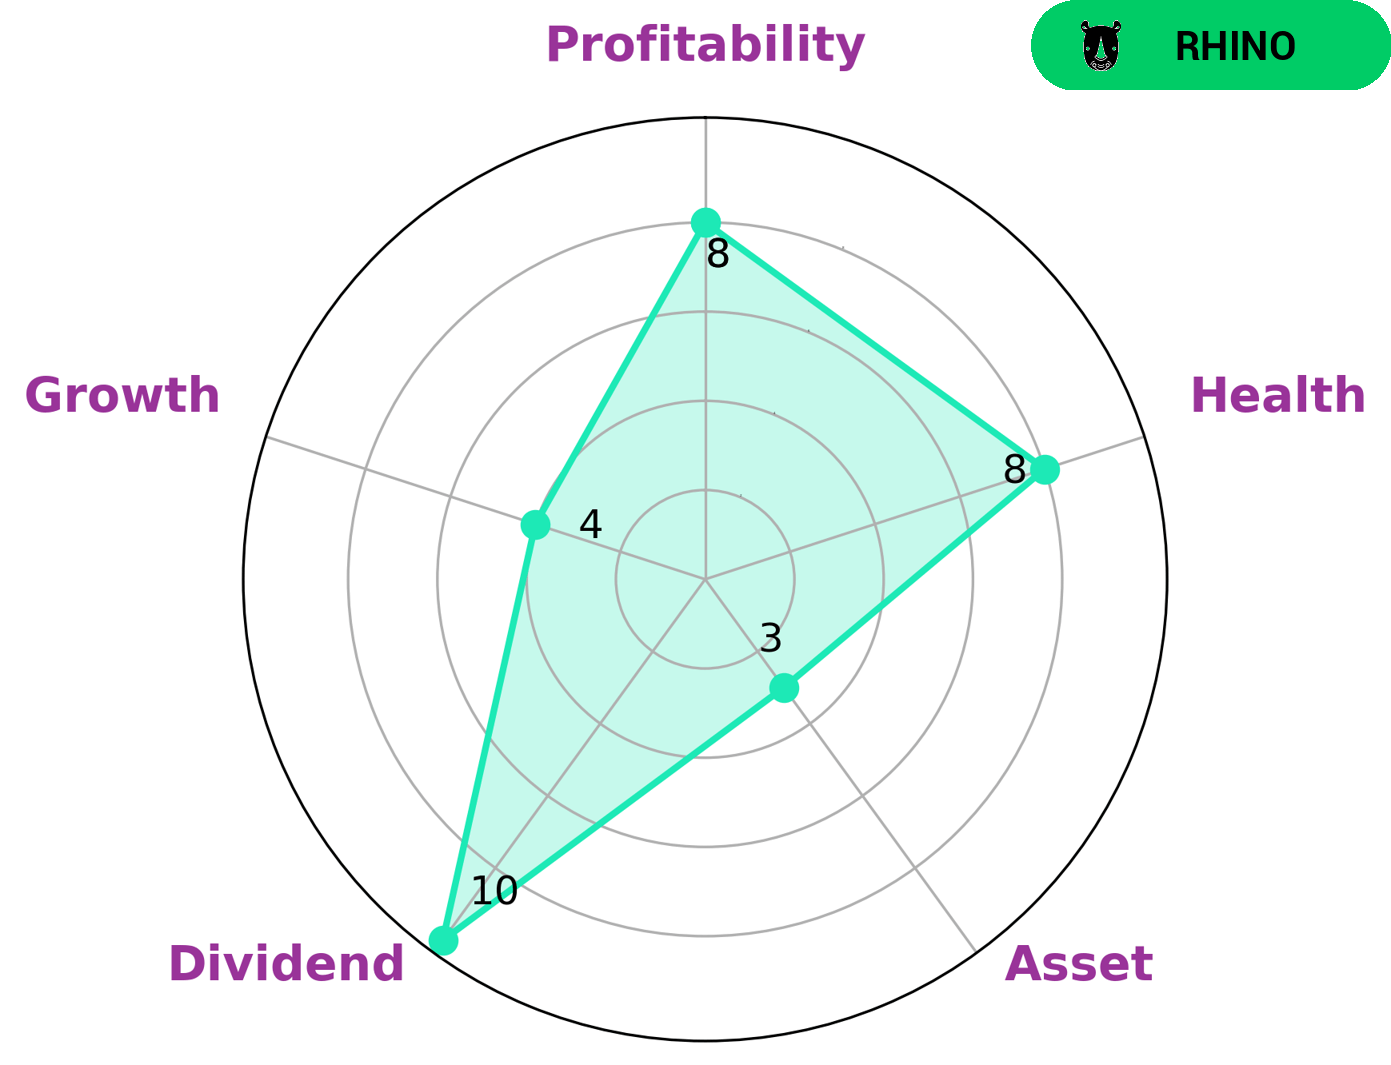
At GoodWhale, we conducted an analysis of the financials of TRANE TECHNOLOGIES. Our Star Chart showed that the company is strong in dividend and profitability, medium in growth, and weak in asset management. Considering the company’s data, we classified TRANE TECHNOLOGIES as a ‘rhino’, a type of company that has achieved moderate revenue or earnings growth. For investors interested in such a company, TRANE TECHNOLOGIES will likely provide a steady investment opportunity with a high health score of 8/10. This score, which is based on cash flows and debt, indicates that TRANE TECHNOLOGIES is capable to safely ride out any crisis without the risk of bankruptcy. More…
Peers
Trane Technologies PLC is a leading global provider of indoor comfort solutions and services. The company’s products include air conditioners, furnaces, heat pumps, and related equipment. Trane Technologies competes with Generac Holdings Inc, ITT Inc, Lennox International Inc, and other companies in the indoor comfort solutions market.
– Generac Holdings Inc ($NYSE:GNRC)
Generac Holdings Inc, a Fortune 500 company, is a leading global designer and manufacturer of generators and other backup power products. The company has a market capitalization of $7.04 billion as of 2022 and a return on equity of 18.99%. Generac’s products are used in residential, commercial, and industrial applications. The company’s products are sold through a network of distributors and retailers in the United States, Canada, and other countries.
– ITT Inc ($NYSE:ITT)
In 2022, KBR had a market capitalization of $5.78 billion and a return on equity of 12.81%. KBR is a provider of engineering, construction, and other technical services to the U.S. government and other customers.
– Lennox International Inc ($NYSE:LII)
Lennox International Inc. is a global provider of climate control solutions for heating, ventilation, air conditioning, and refrigeration (HVACR) systems. The company operates in three segments: Residential Heating & Cooling, Commercial Heating & Cooling, and Refrigeration. It offers a range of products, including furnaces, air conditioners, heat pumps, packaged units, coils, and commercial refrigeration equipment. The company was founded in 1895 and is headquartered in Richardson, Texas.
Summary
Trane Technologies is a global industrial company that recently reported its third quarter earnings. Despite these positive results, the company’s stock price dropped on the same day. This could be an indicator of investor pessimism, with investors not expecting the company to be able to continue this growth into the next quarter. Therefore, investors should analyze Trane Technologies’ financials and future prospects before investing.
Related Posts


Recent Posts


Investing Everyone Can Do.
Investing shouldn’t be exclusive to a select few. We believe everyone should have the opportunity to grow their wealth. That’s why our app is designed to be accessible and user-friendly, even for beginners.
