COPART Reports Q2 FY2023 Earnings Results on February 21, 2023.
March 24, 2023

Earnings Overview
On February 21 2023, COPART ($NASDAQ:CPRT) revealed its earnings results for Q2 of FY2023 – ending on January 31 2023 – with total revenue amounting to USD 293.7 million, a 2.2% rise from the same period in the previous year. Net income also saw an impressive 10.3% year-over-year increase, reaching USD 956.7 million.
Transcripts Simplified
COPART reported a 4.7% year-over-year increase in global unit sales for the second quarter, including a 5% growth in the U.S. and over 10% internationally. U.S. fee units grew about 5%, primarily due to growth in the insurance business, while purchased units declined 23%. Internationally, both fee and purchased units increased nearly 9% and over 23%, respectively. Global revenue increased $89 million or just over 10%, including a 2% or $15 million headwind due to currency.
Global service revenue increased 79 million or over 11% for the quarter, primarily due to a higher average revenue per unit and increased volume. Purchased vehicle sales for the quarter increased $11 million or nearly 7%, with U.S. purchased vehicle revenue for the quarter down 15% and international up 42%. Global gross profit in the second quarter increased by more than 23 million or 5.7%, while the gross margin percentage decreased by approximately 200 basis points to 44.6%.
About the Company
Income Snapshot
Below shows the total revenue, net income and net margin for Copart. More…
| Total Revenues | Net Income | Net Margin |
| 3.67k | 1.08k | 29.8% |
Cash Flow Snapshot
Below shows the cash from operations, investing and financing for Copart. More…
| Operations | Investing | Financing |
| 1.23k | -154.4 | -383.45 |
Balance Sheet Snapshot
Below shows the total assets, liabilities and book value per share for Copart. More…
| Total Assets | Total Liabilities | Book Value Per Share |
| 5.93k | 718.76 | 10.94 |
Key Ratios Snapshot
Some of the financial key ratios for Copart are shown below. More…
| 3Y Rev Growth | 3Y Operating Profit Growth | Operating Margin |
| 18.2% | 19.0% | 36.9% |
| FCF Margin | ROE | ROA |
| 21.6% | 16.9% | 14.3% |
Price History
The stock opened at $68.9 and closed at $69.0, an increase of 0.9% from its previous closing price of $68.4. Investors responded positively to the news, showing confidence in the company’s future prospects. COPART reported solid growth across its core business segments, including online salvage auctions, online used vehicle auctions, and online dealer-only auctions. It attributed this strong performance to its ongoing investments in technology and new products. COPART also announced plans for further expansion in the coming year, including increased investments in customer service and operations.
Overall, COPART had a very positive quarter and is well positioned to continue its strong performance through the rest of the fiscal year. This is good news for investors and should provide a boost to the stock price moving forward. Live Quote…
Analysis
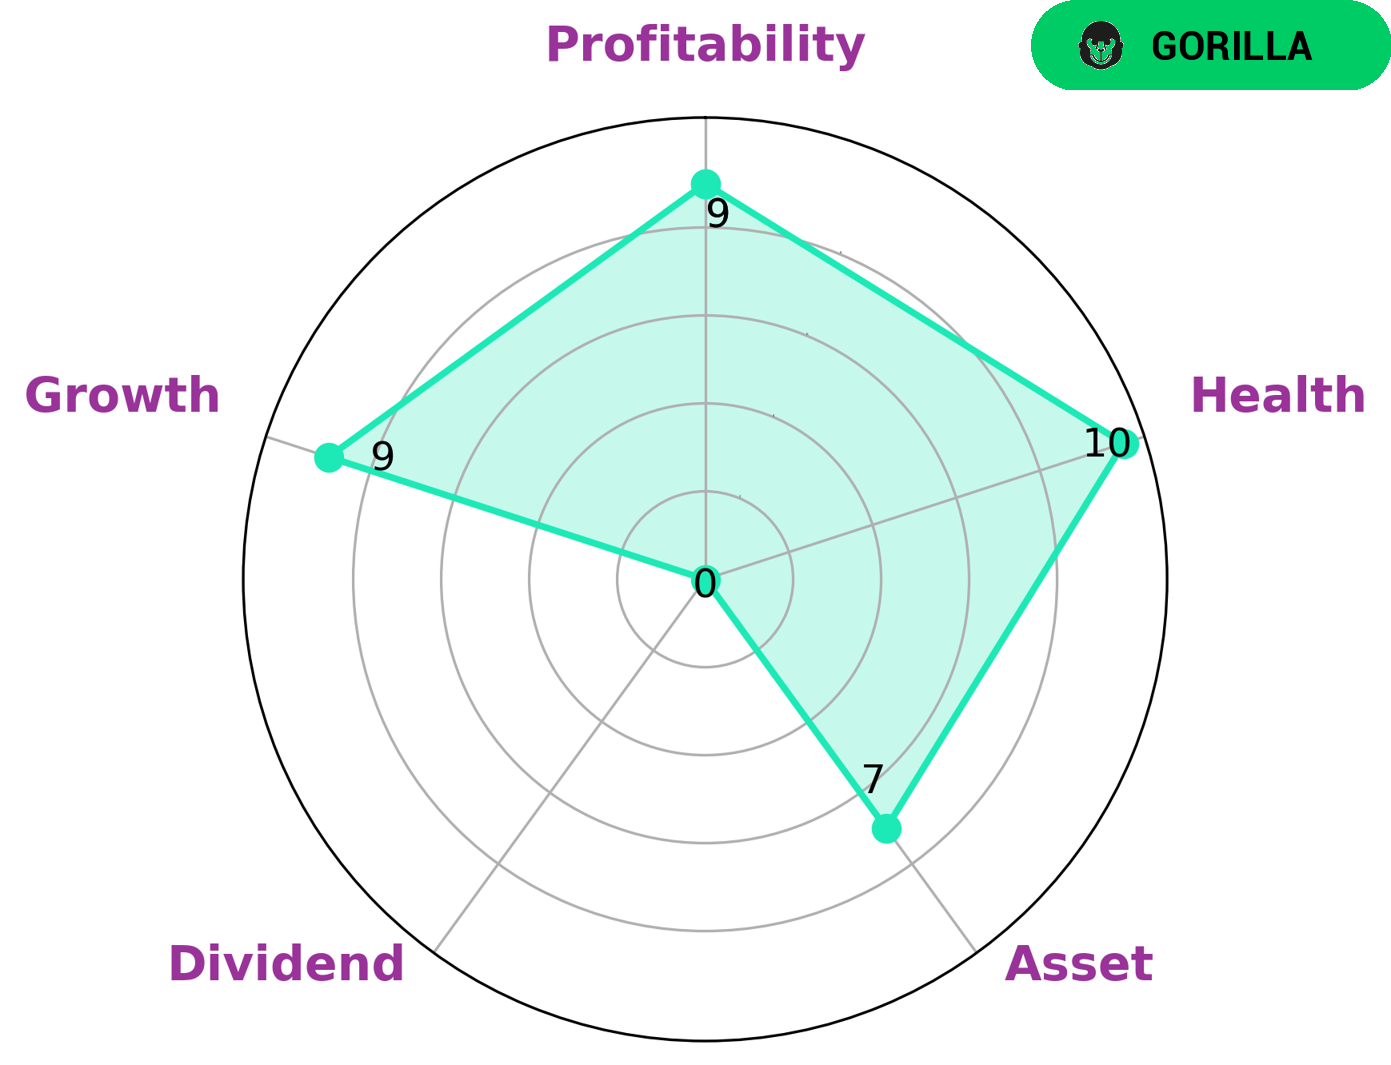
At GoodWhale, we recently conducted an analysis of COPART‘s wellbeing. Using our proprietary Star Chart rating system, COPART achieved a high health score of 10/10 with regard to its cashflows and debt, indicating that the company is well-equipped to sustain operations during times of crisis. In addition, based on the data, we classified COPART as a ‘gorilla,’ which is a type of company that has achieved a stable and high revenue or earnings growth due to its strong competitive advantage. For investors looking to invest in COPART, they should be aware that the company is strong in terms of assets, growth, and profitability, but weak in terms of dividend yields. Therefore, those looking to invest in COPART should consider this in their research and be sure to diversify their portfolio to compensate for any risks that may arise. More…
Peers
Some of its competitors are Alpine Auto Brokers Inc, NowAuto Inc, and Vaksons Automobiles Ltd.
– Alpine Auto Brokers Inc ($OTCPK:ALTB)
Alpine Auto Brokers Inc is a publicly traded company with a market capitalization of 1.61 billion as of 2022. The company has a return on equity of 672.61%. Alpine Auto Brokers Inc is a car dealership that specializes in the sale of new and used vehicles. The company has a network of dealerships across the United States. Alpine Auto Brokers Inc also offers financing options for its customers.
– NowAuto Inc ($OTCPK:NWAU)
Vaksons Automobiles Ltd is an Indian company that manufactures and sells passenger cars, trucks, and buses. The company has a market cap of 167.28M as of 2022 and a Return on Equity of -0.15%. Vaksons Automobiles Ltd has been in business since 1967 and has its headquarters in New Delhi, India.
Summary
COPART reported strong results in Q2 of FY2023, with total revenue growing 2.2% year-over-year to USD 293.7 million. Net income also increased 10.3% to USD 956.7 million. This is a positive sign for potential investors, who should do further research into the company’s fundamentals and financials before investing. COPART’s increasing revenues and profits are encouraging, but it is important to look at factors such as liquidity, risk management, and return on capital when considering investing in the company.
Related Posts


Recent Posts


Investing Everyone Can Do.
Investing shouldn’t be exclusive to a select few. We believe everyone should have the opportunity to grow their wealth. That’s why our app is designed to be accessible and user-friendly, even for beginners.
