Workhorse Group Intrinsic Value – WORKHORSE GROUP Reports Q1 FY2023 Earnings Results on May 15th.
May 26, 2023

Earnings Overview
On May 15 2023, WORKHORSE GROUP ($BER:1WO) reported earnings results for Q1 of FY2023. Compared to the same period last year, total revenue grew significantly from 0.0 million to 1.7 million, while net income decreased slightly from -22.0 million to -25.0 million.
Share Price
On May 15th, WORKHORSE GROUP reported their earnings results for the first quarter of their fiscal year 2023. The stock opened at €0.9 on Monday and closed at €0.8, down by 2.4% from the prior closing price of €0.8. This decrease in stock price reflects the current market sentiment towards the company and their earnings results.
Despite this, WORKHORSE GROUP still has a great potential for growth due to its innovative technology and strong leadership team. Moving forward, investors should keep a close eye on the company’s progress as its future remains uncertain. Live Quote…
About the Company
Income Snapshot
Below shows the total revenue, net income and net margin for Workhorse Group. More…
| Total Revenues | Net Income | Net Margin |
| 6.7 | -120.22 | -1793.7% |
Cash Flow Snapshot
Below shows the cash from operations, investing and financing for Workhorse Group. More…
| Operations | Investing | Financing |
| -95.83 | -21.83 | 29.72 |
Balance Sheet Snapshot
Below shows the total assets, liabilities and book value per share for Workhorse Group. More…
| Total Assets | Total Liabilities | Book Value Per Share |
| 181.38 | 76.56 | 0.58 |
Key Ratios Snapshot
Some of the financial key ratios for Workhorse Group are shown below. More…
| 3Y Rev Growth | 3Y Operating Profit Growth | Operating Margin |
| 310.8% | – | -1830.1% |
| FCF Margin | ROE | ROA |
| -1717.8% | -71.8% | -42.3% |
Analysis – Workhorse Group Intrinsic Value
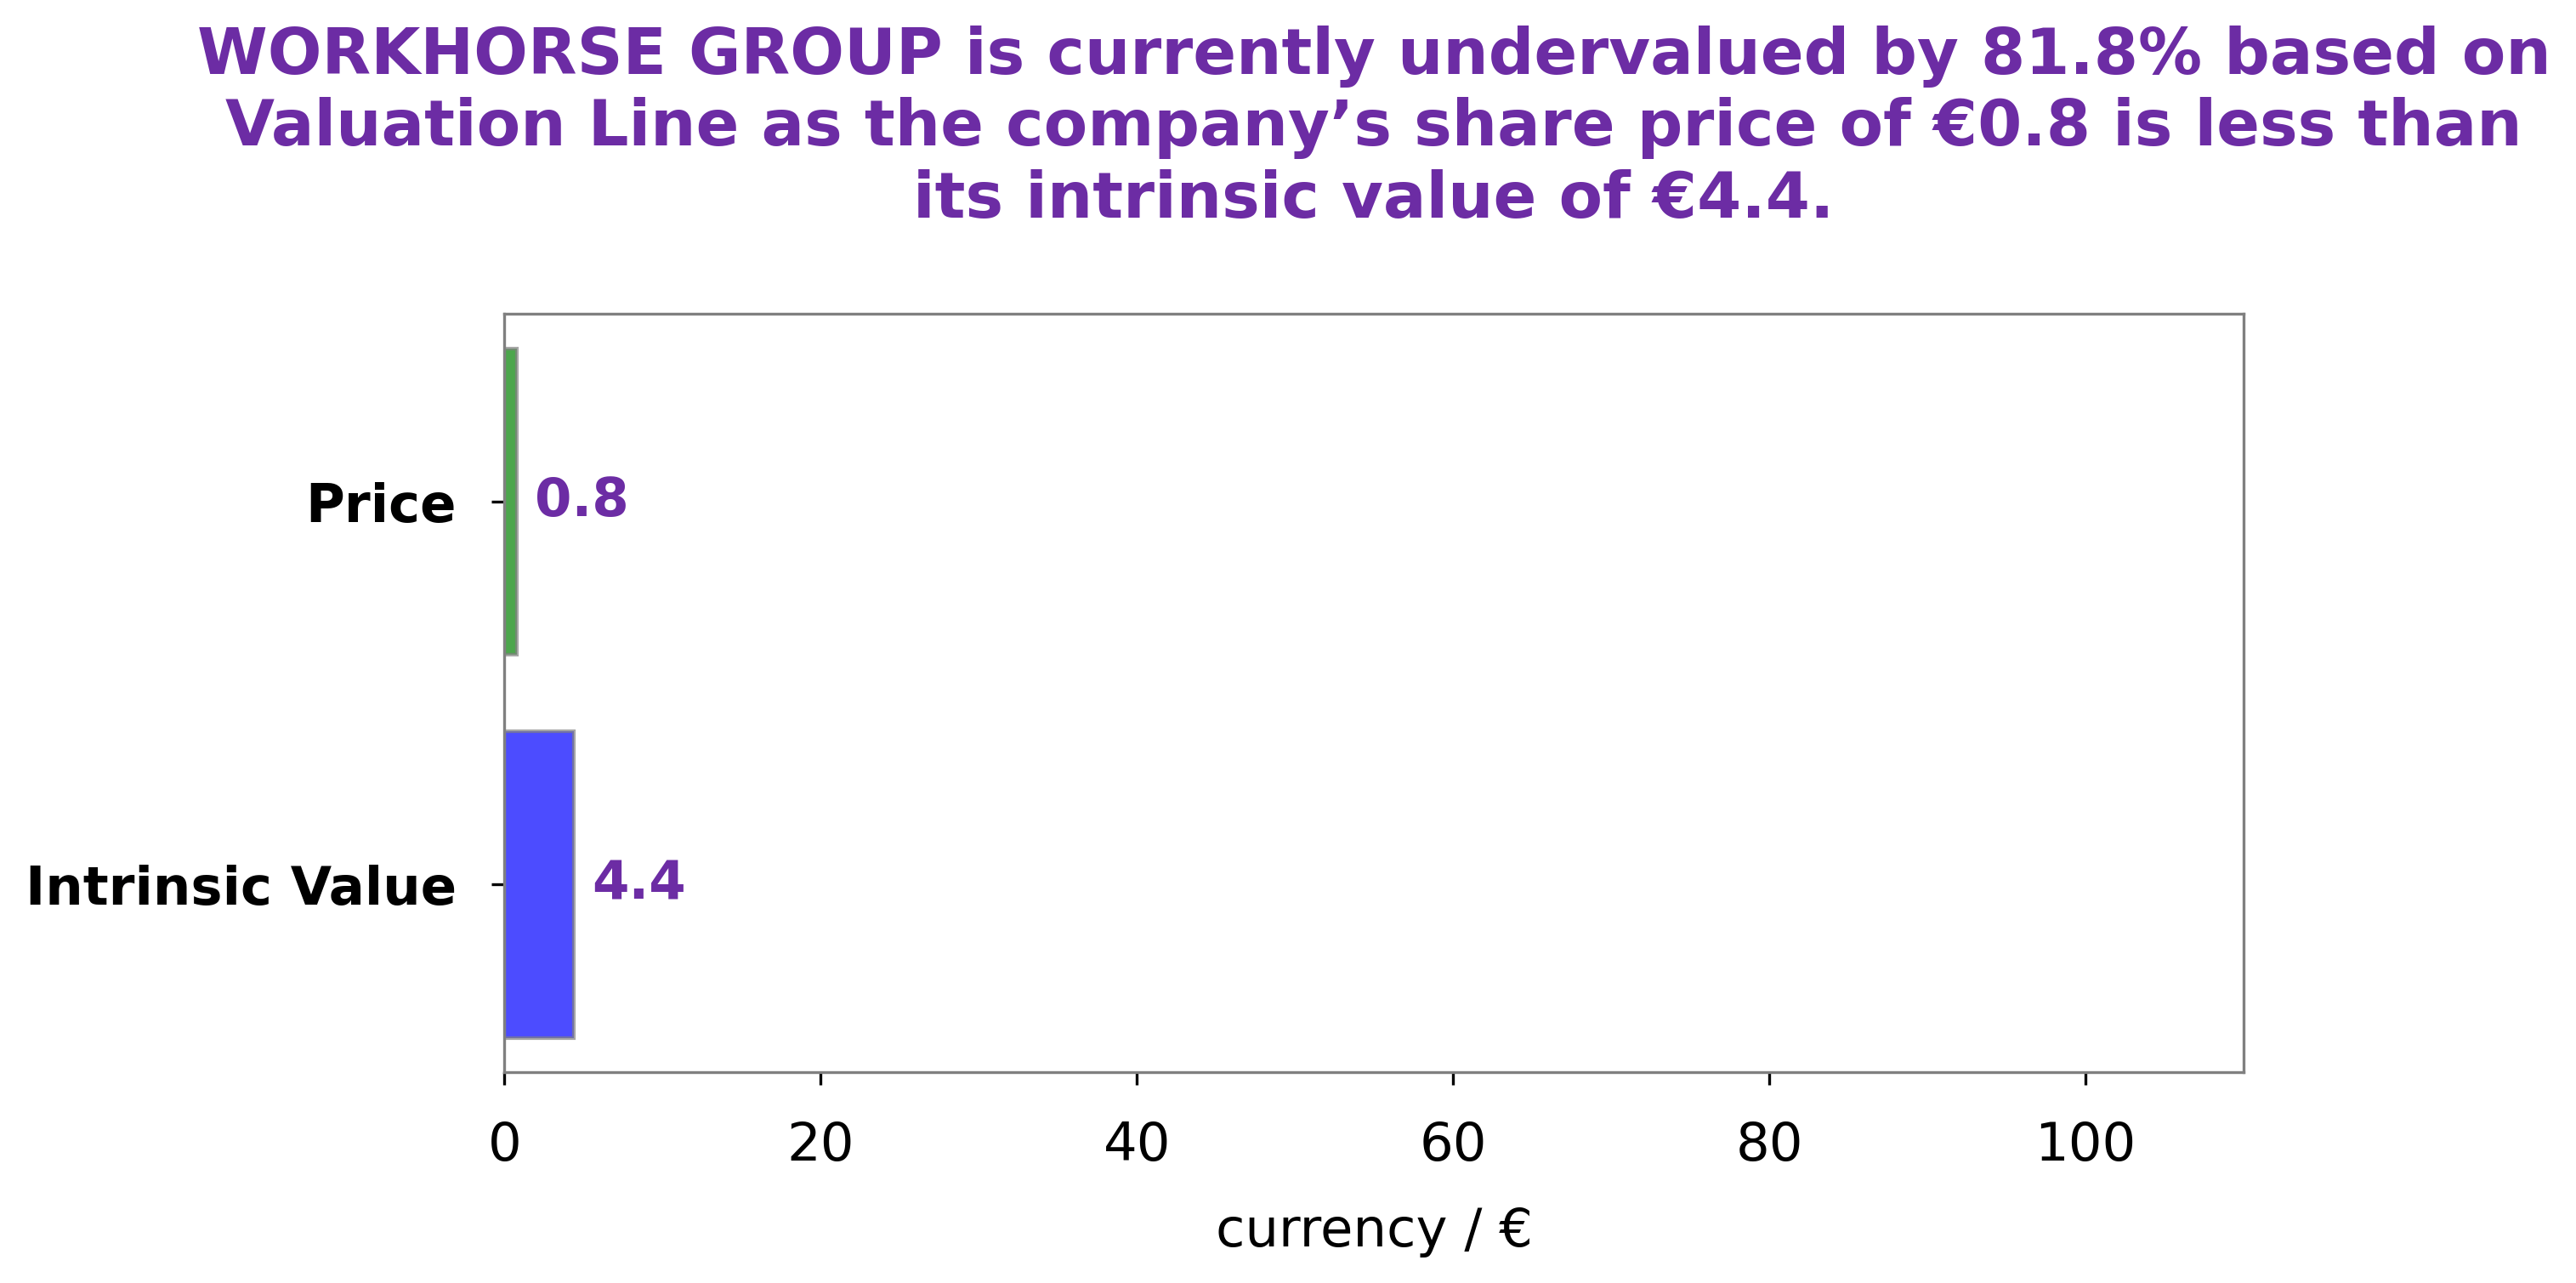
At GoodWhale, we’ve analyzed the fundamentals of WORKHORSE GROUP and have concluded that its fair value is around €4.4. This value was determined by our proprietary Valuation Line. Currently, WORKHORSE GROUP stock is being traded at €0.8, meaning it’s undervalued by a staggering 81.9%. We believe that this presents a fantastic opportunity for investors looking for long-term value. More…
Summary
Despite this impressive performance, the company reported a negative net income of USD 25.0 million, representing a slight decline from the prior year’s result. The increase in revenue is likely driven by a surge in demand for the company’s products and services. Investors may want to consider the company’s long-term prospects given its current financial performance and overall market conditions. Analyzing the potential of its core product lines and assessing the competitive landscape can also help investors make an informed decision about their investment in Workinghorse Group.


