Stellantis Invests in Alliance Nickel to Secure Battery-Grade Nickel and Cobalt Sulphate
April 29, 2023

Trending News ☀️
Stellantis ($NYSE:STLA) is the fourth largest automaker in the world and is now looking to expand its presence in the electric vehicle market. To that end, Stellantis recently invested funds in Alliance Nickel, a Canadian mining and mineral exploration company, to secure battery-grade nickel and cobalt sulphate. The nickel and cobalt sulphate produced by Alliance Nickel have the potential to be used as an affordable and sustainable source of raw material for the production of batteries for Stellantis’s electric vehicles. This investment will allow Stellantis to have access to a reliable source of raw materials for their battery production needs, enabling them to remain competitive in the increasingly crowded electric vehicle market. Alliance Nickel is also looking to produce battery materials from other minerals such as copper, cobalt, and lithium. This will provide Stellantis with a larger supply of raw materials that are necessary for the production of their electric vehicles.
Additionally, Alliance Nickel is committed to using responsible and sustainable practices in their operations, which will help Stellantis meet their goals for environmental sustainability. This partnership will ensure that Stellantis has reliable access to raw materials needed for their battery production and will also help them meet their goals for environmental sustainability.
Price History
On Friday, STELLANTIS NV, the newly formed automotive company, saw their stocks open up at $16.2 and close at $16.6, up 1.3% from the previous day’s closing price of $16.4. This jump in share price follows the company’s recent investment in Alliance Nickel, a producer of battery-grade nickel and cobalt sulphate. The terms of the deal are undisclosed at this time, however it is believed that the investment will provide STELLANTIS with a steady supply of nickel and cobalt sulphate for use in its electric vehicle batteries. Live Quote…
About the Company
Income Snapshot
Below shows the total revenue, net income and net margin for Stellantis Nv. More…
| Total Revenues | Net Income | Net Margin |
| 179.59k | 16.8k | 10.2% |
Cash Flow Snapshot
Below shows the cash from operations, investing and financing for Stellantis Nv. More…
| Operations | Investing | Financing |
| 19.96k | -10.53k | -13.17k |
Balance Sheet Snapshot
Below shows the total assets, liabilities and book value per share for Stellantis Nv. More…
| Total Assets | Total Liabilities | Book Value Per Share |
| 186.16k | 113.77k | 22.98 |
Key Ratios Snapshot
Some of the financial key ratios for Stellantis Nv are shown below. More…
| 3Y Rev Growth | 3Y Operating Profit Growth | Operating Margin |
| 18.4% | 62.0% | 11.4% |
| FCF Margin | ROE | ROA |
| 6.1% | 18.6% | 6.9% |
Analysis
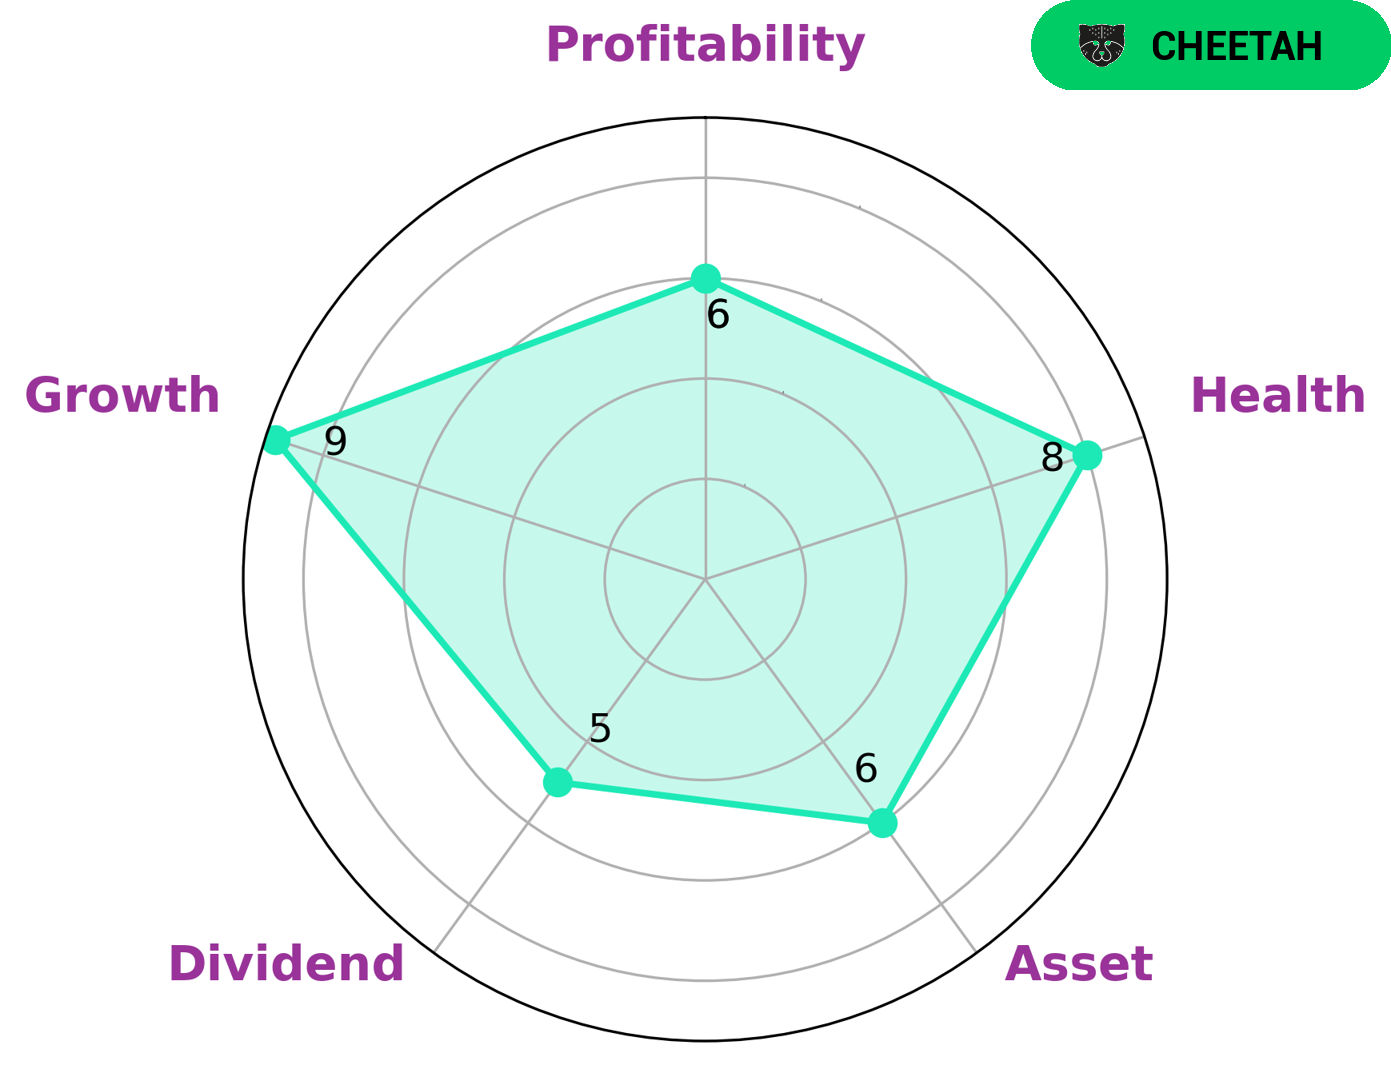
At GoodWhale, we conducted an analysis of STELLANTIS NV‘s fundamentals to determine its financial health. Our star chart showed that STELLANTIS NV had strong growth, medium asset, dividend, and profitability. Thus, we concluded that STELLANTIS NV had an overall health score of 8/10 when it comes to its cashflows and debt and is capable of riding out any crisis without the risk of bankruptcy. We also identified STELLANTIS NV as a ‘cheetah’, a type of company that achieved high revenue or earnings growth but is considered less stable due to lower profitability. We believe that this type of company is attractive to investors who are looking for quick return on their investments but may be less able to handle potential risks that come with those returns. More…
Peers
The competition between Stellantis NV and its competitors is fierce. Ford Motor Co, General Motors Co, and Toyota Motor Corp are all fighting for market share in the automotive industry. Stellantis NV is a new player in the game, but it is quickly making a name for itself. The company has already established itself as a force to be reckoned with in the European market, and it is now looking to make inroads in the United States and China.
– Ford Motor Co ($NYSE:F)
Ford Motor Company is an American multinational automaker that has its main headquarters in Dearborn, Michigan, a suburb of Detroit. The company sells automobiles and commercial vehicles under the Ford brand and most luxury cars under the Lincoln brand. Ford also owns Brazilian SUV manufacturer Troller, an 8% stake in Aston Martin of the United Kingdom, and a 32% stake in Jiangling Motors of China. It also has joint-ventures in China, Taiwan, Thailand, Turkey, and Russia. The company is listed on the New York Stock Exchange and is controlled by the Ford family; they have minority ownership but the majority of the voting power.
As of 2022, Ford Motor Company has a market capitalization of $47.56 billion and a return on equity of 23.7%. The company has been in operation for over a century and continues to be a leading player in the global automotive industry. Ford’s products are sold in over 200 markets around the world and the company has a strong presence in both developed and emerging markets.
– General Motors Co ($NYSE:GM)
General Motors Co., commonly referred to as GM, is an American multinational corporation headquartered in Detroit that designs, manufactures, markets, and distributes vehicles and vehicle parts, and sells financial services.
As of 2020, GM had a market capitalization of $48.95 billion. This is down from $52.6 billion in 2019. GM’s return on equity was 10.52% in 2020. This is down from 11.92% in 2019.
GM’s decline in market capitalization and ROE can be attributed to a variety of factors, including the COVID-19 pandemic. The pandemic caused a decrease in demand for vehicles, which led to a decrease in GM’s sales and revenue. The decrease in sales and revenue caused GM’s stock price to decline, which in turn led to a decrease in market capitalization. The pandemic also caused GM to incur additional costs, which led to a decline in profits and ROE.
– Toyota Motor Corp ($TSE:7203)
Toyota Motor Corp is one of the largest automakers in the world with a market cap of 27.37T as of 2022. It has a Return on Equity of 11.32%. Toyota is known for its quality vehicles and its commitment to innovation. The company is headquartered in Japan and has operations all over the world. Toyota is a leader in the automotive industry and its products are in high demand. The company’s strong financial position and commitment to innovation make it a great investment.
Summary
Stellantis NV is an automotive company that recently announced its decision to invest money in Alliance Nickel, a company that specializes in battery grade nickel and cobalt sulphate. This investment is part of Stellantis’ strategy to become a major player in the electric vehicle sector, as battery grade nickel and cobalt sulphate are essential components for creating lithium-ion batteries. By investing in Alliance Nickel, Stellantis is hoping to secure a reliable and cost-effective supply of these materials, thereby potentially strengthening its own long-term position in the electric vehicle market. Additionally, the investment is beneficial for Alliance Nickel, as it will provide them with a dependable customer and a valuable strategic partner.
Related Posts


Recent Posts


Investing Everyone Can Do.
Investing shouldn’t be exclusive to a select few. We believe everyone should have the opportunity to grow their wealth. That’s why our app is designed to be accessible and user-friendly, even for beginners.
