TJX Companies Sees Modest Gain in Trading, But Lags Behind S&P 500 Performance Today
November 8, 2024

🌧️Trending News
TJX ($NYSE:TJX) Companies, also known as TJX, is an American multinational off-price department store corporation that operates over 4,500 stores across nine countries under various brands such as T.J. Maxx, Marshalls, HomeGoods, and Sierra. Today, TJX saw a modest gain in trading, with the stock price increasing by 1.65% compared to the previous day. This increase can be attributed to the company’s strong performance in the retail sector and its ability to offer discounted prices on popular brands to its customers.
However, despite this gain, TJX lags behind the overall market performance as seen by the S&P 500’s daily gain of 2.53%. As many consumers shifted to online shopping during the pandemic, traditional brick-and-mortar retailers like TJX faced challenges in maintaining their sales and profits. However, with the easing of restrictions and the reopening of physical stores, TJX has been able to see some growth in its stock price. Moreover, TJX’s performance today also reflects the ongoing volatility in the stock market, where various external factors can influence a company’s stock price. Despite this, TJX has a strong track record of consistently delivering positive earnings and is considered a reliable investment option by many analysts. Overall, while TJX may have lagged behind the S&P 500’s daily performance today, it still remains a strong player in the retail sector and has shown resilience in adapting to changing market conditions. With its diverse portfolio of brands and a loyal customer base, TJX is well-positioned to continue its growth trajectory in the future.
Stock Price
TJX Companies, a leading off-price retailer, saw a modest gain in trading on Wednesday as its stock opened at $116.14 and closed at $115.63, representing a 1.65% increase from the prior day’s closing price of $113.75. The modest gain in trading for TJX Companies can be attributed to the company’s strong financial performance in recent months.
However, despite these positive results, TJX Companies’ stock has not seen the same level of growth as the broader market. This may be due to concerns about the company’s ability to sustain its growth in the face of increased competition from online retailers and changing consumer preferences. It is also worth noting that this modest gain in trading for TJX Companies comes after the company’s stock experienced a dip in early June following the news of its data breach, which may have impacted investor confidence. In comparison, the S&P 500 index has been performing well in recent weeks, reaching new record highs due to positive economic data and expectations of a strong recovery from the pandemic. This could explain why TJX Companies’ stock has lagged behind the index’s performance today. Overall, while TJX Companies’ stock saw a modest gain in trading on Wednesday, it was unable to keep pace with the performance of the S&P 500. As the company continues to navigate through the challenges of the retail industry, investors will be closely monitoring its future performance and how it compares to its competitors and the broader market. Live Quote…
About the Company
Income Snapshot
Below shows the total revenue, net income and net margin for Tjx Companies. More…
| Total Revenues | Net Income | Net Margin |
| 54.22k | 4.47k | 8.3% |
Cash Flow Snapshot
Below shows the cash from operations, investing and financing for Tjx Companies. More…
| Operations | Investing | Financing |
| 6.06k | -1.72k | -4.21k |
Balance Sheet Snapshot
Below shows the total assets, liabilities and book value per share for Tjx Companies. More…
| Total Assets | Total Liabilities | Book Value Per Share |
| 29.75k | 22.45k | 6 |
Key Ratios Snapshot
Some of the financial key ratios for Tjx Companies are shown below. More…
| 3Y Rev Growth | 3Y Operating Profit Growth | Operating Margin |
| 19.0% | 115.1% | 10.7% |
| FCF Margin | ROE | ROA |
| 8.0% | 53.0% | 12.2% |
Analysis
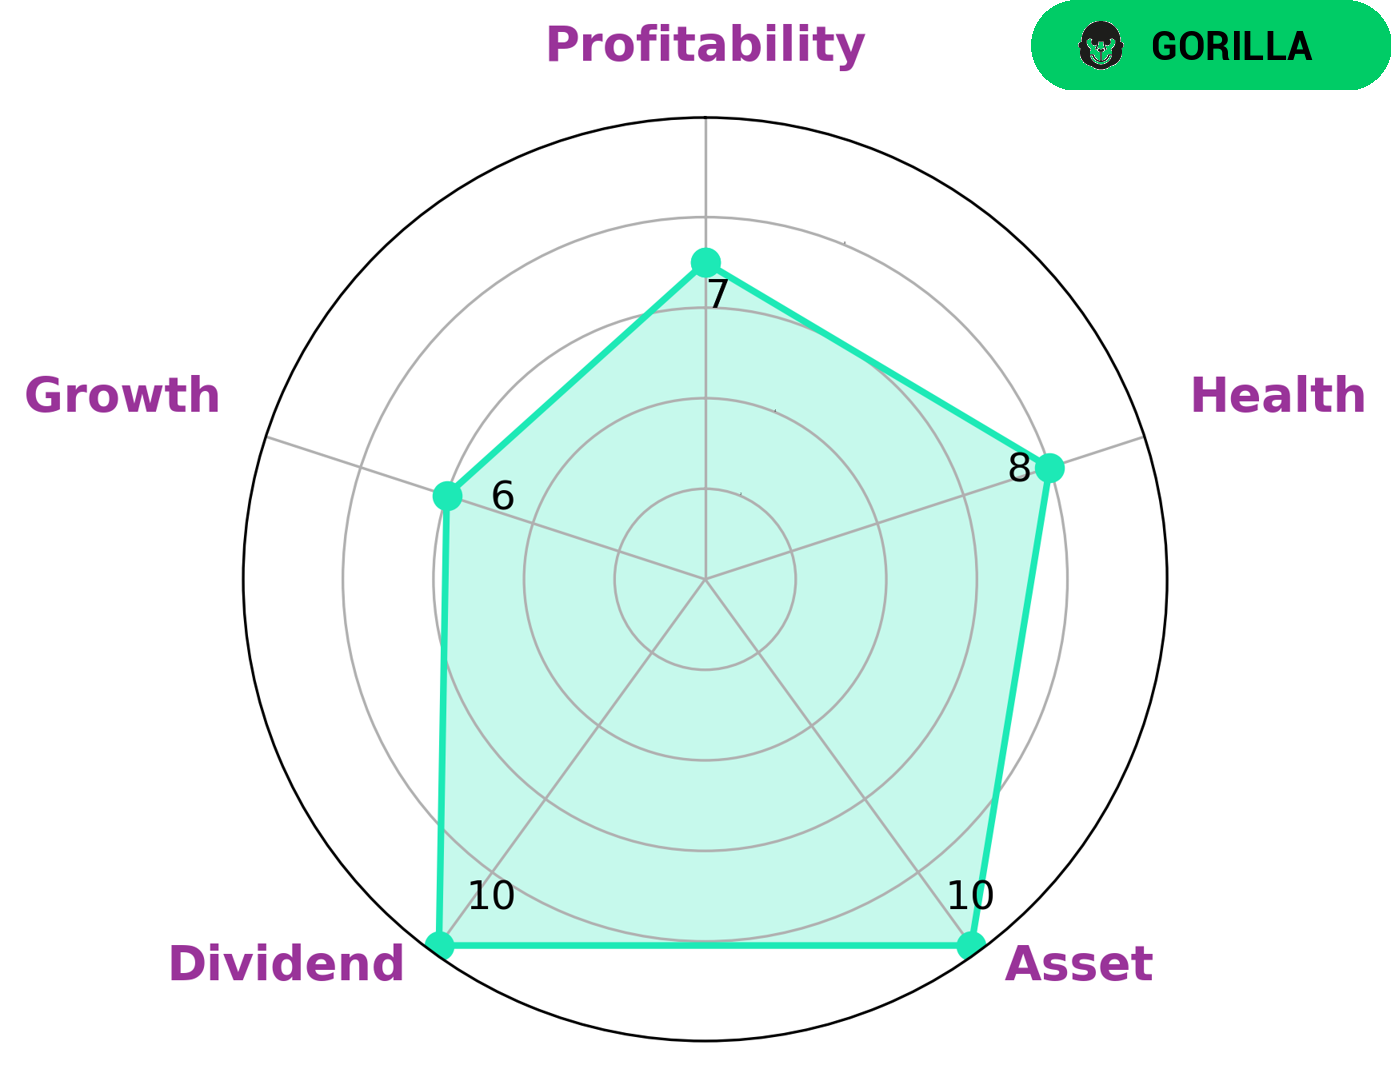
After conducting a thorough analysis of TJX COMPANIES‘ wellbeing, it is clear to me that this company is in a strong financial position. The Star Chart rating system gives TJX COMPANIES a high health score of 8 out of 10, indicating that it is capable of weathering any financial crisis without the risk of bankruptcy. This is due to its solid cashflows and manageable debt levels. In addition, TJX COMPANIES falls into the category of ‘gorilla’ companies, which are those that have achieved stable and high revenue or earning growth due to their strong competitive advantage. This further reinforces the company’s financial strength and stability. Based on its strong performance in several key areas, TJX COMPANIES may be of interest to a variety of investors. Its high health score and gorilla status make it an attractive option for conservative investors who prioritize stability and safety. On the other hand, its strong asset base, consistent dividend payments, and profitability make it appealing to income-seeking investors. Furthermore, TJX COMPANIES also shows potential for future growth, albeit at a medium level. This may attract growth-oriented investors who are looking for opportunities with both stability and potential for growth. In conclusion, TJX COMPANIES stands out as a strong and stable company in the retail industry, making it a compelling choice for a range of investors. Its high health score, gorilla status, and strong performance in key areas make it a solid investment option. More…
Peers
In the retail industry, there is intense competition between TJX Companies Inc and its competitors Ross Stores Inc, Destination Maternity Corp, and United Arrows Ltd. This is due to the fact that each company is vying for the same consumers. In order to attract and retain customers, each company must offer competitive prices, a wide variety of merchandise, and excellent customer service.
– Ross Stores Inc ($NASDAQ:ROST)
Ross Stores is an American chain of off-price department stores headquartered in Dublin, California, founded in 1957 by Morris Ross. The company operates 1,378 Ross Dress for Less locations and 122 dd’s Discounts locations in 37 states, the District of Columbia and Guam. Ross Stores Inc has a market cap of 29.23B as of 2022, a Return on Equity of 30.69%. Ross Stores is an American chain of off-price department stores headquartered in Dublin, California, founded in 1957 by Morris Ross. The company operates 1,378 Ross Dress for Less locations and 122 dd’s Discounts locations in 37 states, the District of Columbia and Guam. Ross Dress for Less offers first-quality, in-season, name brand and designer apparel, accessories, footwear and home fashions for the entire family at every day savings of 20% to 60% off department and specialty store regular prices. dd’s Discounts is designed to offer brand-name apparel, accessories, footwear and home fashions for the entire family at 20% to 70% off moderate department and discount store prices every day.
– Destination Maternity Corp ($OTCPK:DESTQ)
Destination Maternity Corporation is an international retailer of maternity apparel, selling its products under the Destination Maternity®, Motherhood Maternity®, A Pea in the Pod® and Destination Baby® brands. The Company also operates ecommerce websites, destinationmaternity.com in the United States, motherhood.com and apeainthepod.com. As of October 28, 2017, Destination Maternity operated 1,944 retail locations, including 512 stores in the United States, Puerto Rico and Canada, and 1,432 leased department locations. The Company’s retail locations are located in the United States, Puerto Rico, Canada and the United Kingdom.
– United Arrows Ltd ($TSE:7606)
United Arrows Ltd is a Japanese fashion retailer. The company was founded in 1989 and is headquartered in Tokyo, Japan. United Arrows Ltd has a market cap of 58.64B as of 2022, a Return on Equity of 9.39%. The company operates over 800 stores across Japan and also has a presence in Hong Kong, China, and Taiwan. United Arrows Ltd offers a wide range of products including men’s and women’s clothing, accessories, and beauty products. The company has a strong focus on quality and design, and its products are popular among Japanese consumers.
Summary
TJX Companies, a leading off-price retailer, saw a 1.65% increase in its stock price in the latest trading session.
However, this gain lagged behind the overall market, as the S&P 500 recorded a 2.53% increase. This could be attributed to various factors, such as the company’s recent financial performance or market sentiment towards the retail industry. Investors should keep a close eye on the company’s future earnings reports and any potential changes in the competitive landscape to make informed investment decisions. Overall, TJX Companies’ stock performance in relation to the market suggests that it may be facing some challenges that warrant further analysis.
Related Posts


Recent Posts


Investing Everyone Can Do.
Investing shouldn’t be exclusive to a select few. We believe everyone should have the opportunity to grow their wealth. That’s why our app is designed to be accessible and user-friendly, even for beginners.
