ROSS Stock Rises Wednesday, But Trails Market Performance
November 3, 2023

🌥️Trending News
Wednesday proved to be a positive day for Ross Stores ($NASDAQ:ROST) Inc., with the company’s stock rising on the day.
However, despite this increase, Ross Stores still lagged behind the performance of the broader market. Ross Stores is one of the largest off-price retailers in the United States, offering clothing, accessories, and home décor goods to budget-conscious shoppers. Ross Stores has managed to stay afloat during the pandemic, and their sales have grown as shoppers look for bargains to save money. While stock prices are currently up, investors are hoping for further performance gains in the future from Ross Stores.
Price History
On Wednesday, ROSS STORES stock opened at $116.5 and closed at $118.3, marking a surge of 2.0% from the closing price of 116.0 the day before. The stock has seen a steady uptrend since early February, as investors have been bullish on the discount retailer’s prospects. This was driven by strong customer traffic and an uptick in average transaction size. With strong fundamentals and a solid outlook, the stock is likely to continue to outperform in the coming months. Live Quote…
About the Company
Income Snapshot
Below shows the total revenue, net income and net margin for Ross Stores. More…
| Total Revenues | Net Income | Net Margin |
| 19.21k | 1.61k | 8.4% |
Cash Flow Snapshot
Below shows the cash from operations, investing and financing for Ross Stores. More…
| Operations | Investing | Financing |
| 2.86k | -774.18 | -1.41k |
Balance Sheet Snapshot
Below shows the total assets, liabilities and book value per share for Ross Stores. More…
| Total Assets | Total Liabilities | Book Value Per Share |
| 13.99k | 9.53k | 12.65 |
Key Ratios Snapshot
Some of the financial key ratios for Ross Stores are shown below. More…
| 3Y Rev Growth | 3Y Operating Profit Growth | Operating Margin |
| 14.5% | 43.2% | 10.9% |
| FCF Margin | ROE | ROA |
| 10.9% | 30.3% | 9.3% |
Analysis
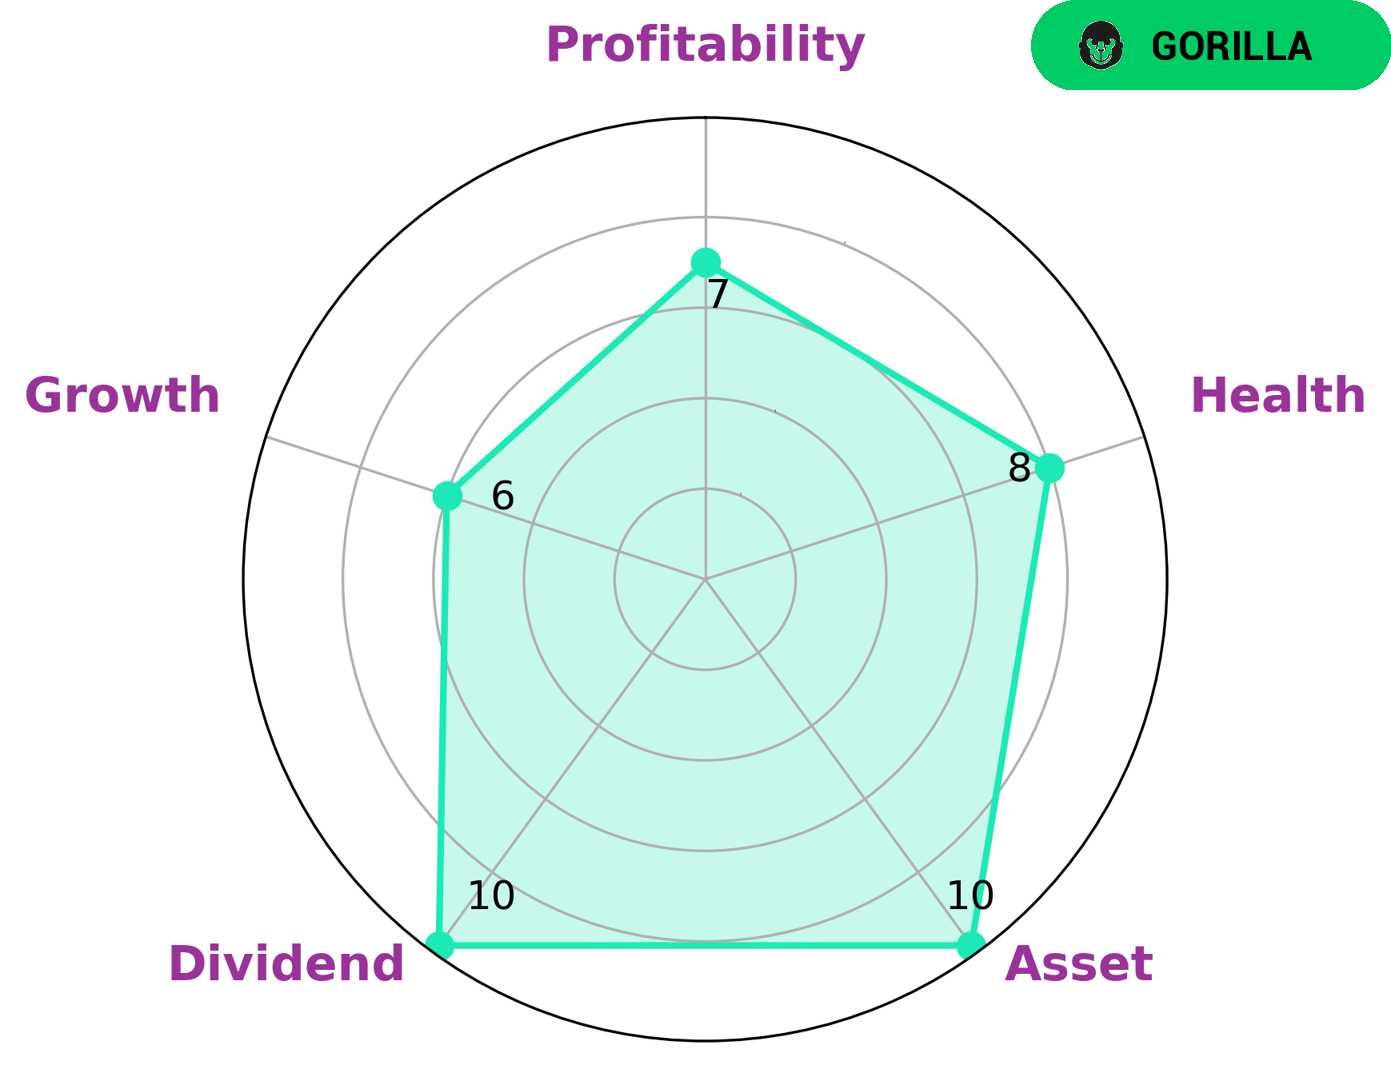
As GoodWhale analysts, we have conducted a detailed analysis of the fundamentals of Ross Stores. Through our analysis, we have classified Ross Stores as a ‘gorilla’ company, which indicates that it has achieved strong and stable revenue and earning growth due to its strong competitive advantage. From our Star Chart analysis, we can conclude that Ross Stores is strong in terms of asset, profitability, and medium in dividend and growth. Furthermore, its health score is a high 9/10, which suggests that Ross Stores is highly capable of paying off debt and funding future operations with its cashflows and debt. This indicates that Ross Stores is an attractive investment opportunity for investors looking for a company with a solid competitive advantage and good financial health. More…
Peers
Though it may not seem like it at first, the retail industry is actually fiercely competitive. This is especially true for those in the discount retail sector, where companies like Ross Stores Inc. must compete with the likes of Burlington Stores Inc, Kohl’s Corp, and Chiyoda Co Ltd. In order to stay ahead, Ross Stores Inc. has to offer low prices and a good selection of merchandise.
– Burlington Stores Inc ($NYSE:BURL)
Burlington Stores Inc is an American off-price department store retailer, headquartered in Burlington, New Jersey. It was founded in 1972 and has grown to operate over 700 stores in 45 states and Puerto Rico. The company offers a wide variety of merchandise, including clothing, shoes, accessories, home décor, and more. Burlington Stores Inc has a market cap of 9.89B as of 2022. The company’s return on equity is 28.14%. Burlington Stores Inc is a publicly traded company on the New York Stock Exchange (NYSE) under the ticker symbol “BURL.”
– Kohl’s Corp ($NYSE:KSS)
Kohl’s Corp is a publicly traded company with a market cap of 3.66B as of 2022. The company has a return on equity of 16.46%. Kohl’s Corp is a retail company that operates department stores in the United States. The company was founded in 1962 and is headquartered in Menomonee Falls, Wisconsin.
– Chiyoda Co Ltd ($TSE:8185)
Chiyoda Co Ltd is a Japanese engineering company. The company has a market cap of 26.54B as of 2022 and a Return on Equity of -2.63%. The company provides engineering, procurement, and construction services for the oil, gas, chemicals, power, and other industries.
Summary
Ross Stores Inc. has seen a rise in its stock price on Wednesday, however the stock has yet to outperform the overall market. Investors should consider whether the current share price is attractive in comparison to the stock’s performance over the last year, as well as the company’s fundamentals. Ross Stores has reported strong quarterly results, with solid revenue and profits growth. The company has also delivered some positive news in terms of its cash flow, operating margins, and balance sheet.
However, investors should understand that the retail sector is a competitive space which carries its own risks. Ross Stores’ stock could be affected by macroeconomic conditions, as well as potential shifts in consumer spending. Therefore, investors should perform their own due diligence and research before making a decision to invest.


Investing Everyone Can Do.
Investing shouldn’t be exclusive to a select few. We believe everyone should have the opportunity to grow their wealth. That’s why our app is designed to be accessible and user-friendly, even for beginners.
