LULULEMON ATHLETICA Reports Third Quarter Earnings Results for FY2024
December 18, 2023

🌥️Earnings Overview
LULULEMON ATHLETICA ($NASDAQ:LULU) released their financial report for the 3rd quarter of FY2024 that concluded on October 31 2023. The company’s overall revenue was USD 2204.2 million, which was a growth of 18.7% compared to the same period of the previous year. Nevertheless, their net income dropped 2.6% year over year to USD 248.7 million.
Price History
On Thursday, Lululemon Athletica reported its third quarter earnings results for fiscal year 2024. The stock opened the day at $460.7 and closed at $464.7, representing a 0.9% increase from the previous day’s closing price of $460.7. Investors reacted positively to the news as the company reported strong revenue growth and profits for the quarter. Lululemon discussed their continued commitment to digital investments and e-commerce initiatives, which they believe have contributed to their success this quarter and will remain important going forward.
Additionally, the company highlighted its focus on continued innovative product releases and international expansion as key drivers of growth in the future. Overall, investors were pleased with the company’s strong performance and are hopeful for what the future holds for Lululemon Athletica. Live Quote…
About the Company
Income Snapshot
Below shows the total revenue, net income and net margin for Lululemon Athletica. More…
| Total Revenues | Net Income | Net Margin |
| 9.19k | 1k | 14.3% |
Cash Flow Snapshot
Below shows the cash from operations, investing and financing for Lululemon Athletica. More…
| Operations | Investing | Financing |
| 1.96k | -628.4 | -578.64 |
Balance Sheet Snapshot
Below shows the total assets, liabilities and book value per share for Lululemon Athletica. More…
| Total Assets | Total Liabilities | Book Value Per Share |
| 6.02k | 2.5k | 27.93 |
Key Ratios Snapshot
Some of the financial key ratios for Lululemon Athletica are shown below. More…
| 3Y Rev Growth | 3Y Operating Profit Growth | Operating Margin |
| 31.2% | 36.0% | 21.9% |
| FCF Margin | ROE | ROA |
| 14.2% | 35.7% | 20.9% |
Analysis
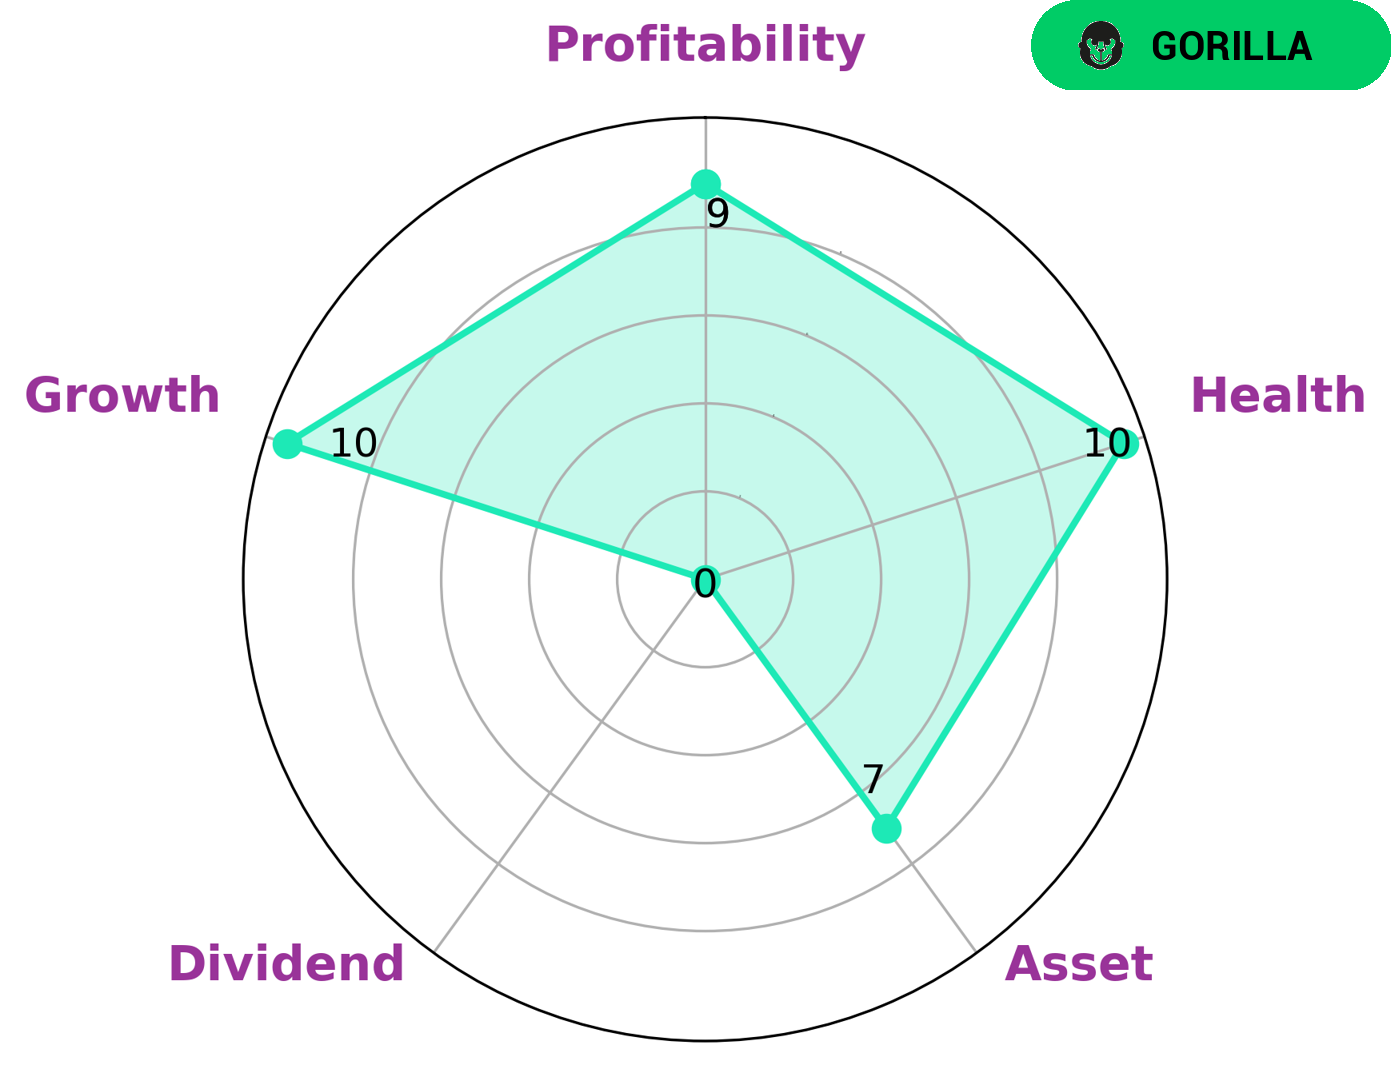
GoodWhale is an analysis platform that makes it easy for investors to evaluate the fundamentals of LULULEMON ATHLETICA. Using the Star Chart, we can see that LULULEMON ATHLETICA is classified as a ‘gorilla’; a type of company that has achieved stable and high revenue or earning growth due to its strong competitive advantage. This makes it an attractive investment for value and growth investors alike. On the financial side, our health score of 10/10 reveals that LULULEMON ATHLETICA is in a strong position to sustain future operations in times of crisis. The company is strong in asset, growth, and profitability but weak in dividend. Investors interested in investing in a company with a solid foundation and strong financials should look no further than LULULEMON ATHLETICA. More…
Peers
Lululemon Athletica Inc is a yoga-inspired, technical athletic apparel company for women. The company operates in the United States, Canada, and Australia. Lululemon Athletica Inc’s main competitors are Buckle Inc, Citi Trends Inc, and Tilly’s Inc.
– Buckle Inc ($NYSE:BKE)
Buckle Inc is a leading retailer of casual apparel, footwear, and accessories for young men and women in the United States. As of 2022, the company has a market capitalization of 1.77 billion dollars and a return on equity of 55.65%. Buckle Inc operates over 450 stores in 44 states across the country, and offers its products through its website and catalog. The company’s mission is to provide great fashion at a great value for its customers.
– Citi Trends Inc ($NASDAQ:CTRN)
Citi Trends Inc is a value-priced retailer of urban fashion apparel, accessories and home décor. The company operates over 600 stores in 31 states. Citi Trends’ mission is to be the largest and most convenient source of trend-right fashion at the right price for our target demographic of urban youth.
– Tilly’s Inc ($NYSE:TLYS)
Tilly’s Inc is a company that operates in the retail industry. The company has a market cap of 239.38M as of 2022 and a return on equity of 19.35%. The company operates through two segments: stores and e-commerce. The company offers a variety of products including apparel, footwear, and accessories for men, women, and children. The company operates stores in California, Arizona, Nevada, and Texas.
Summary
Lululemon Athletica‘s revenue for the third quarter of FY2024 was up 18.7% year-over-year, reaching USD 2204.2 million. Despite this impressive growth, net income for the period declined 2.6% year-over-year to USD 248.7 million. Investors may be encouraged by the strong revenue growth, but should also take into account the decline in net income when considering investing in the company. It is important to continue to monitor the company’s performance and assess the potential risks associated with investing in Lululemon Athletica.
Related Posts


Recent Posts


Investing Everyone Can Do.
Investing shouldn’t be exclusive to a select few. We believe everyone should have the opportunity to grow their wealth. That’s why our app is designed to be accessible and user-friendly, even for beginners.
