GAP Reports Non-GAAP EPS of $0.01, Beats Estimates by $0.17, Revenue of $3.28B In-Line
May 27, 2023

Trending News 🌥️
GAP ($NYSE:GPS) Inc. recently reported its non-GAAP earnings per share (EPS) of $0.01, exceeding market expectations by $0.17. Revenue of $3.28B was in line with what analysts had estimated. GAP Inc. is an American worldwide clothing and accessories retailer. They specialize in casual lifestyle apparel and accessories for men, women, and children, as well as maternity and intimates collections. The company’s strong performance is due in part to a successful digital strategy, resulting in increased online sales and improved customer experiences.
Despite the challenges of the pandemic, GAP Inc. has managed to remain profitable by focusing on innovation and adapting to the changing business environment. Overall, GAP Inc’s non-GAAP EPS beat market expectations and revenue remained in line with estimates. This indicates that the company is well-positioned to continue its growth and remain a leader in the fashion industry.
Earnings
GAP recently released its fourth-quarter earnings report for the fiscal year 2023, ending January 31, 2023. The results showed that GAP earned 4243.0M USD in total revenue and experienced a net income loss of 273.0M USD. Compared to the previous year, this represents a 6.2% decrease in total revenue.
Additionally, GAP’s total revenue has declined steadily over the past three years, reaching 4243.0M USD from 4424.0M USD. On a non-GAAP basis, GAP reported earnings per share of $0.01, beating estimates by $0.17 and showing revenue of $3.28B in-line with estimates.
About the Company
Income Snapshot
Below shows the total revenue, net income and net margin for Gap. GAP_Reports_Non-GAAP_EPS_of_0.01_Beats_Estimates_by_0.17_Revenue_of_3.28B_In-Line”>More…
| Total Revenues | Net Income | Net Margin |
| 15.62k | -202 | -1.3% |
Cash Flow Snapshot
Below shows the cash from operations, investing and financing for Gap. GAP_Reports_Non-GAAP_EPS_of_0.01_Beats_Estimates_by_0.17_Revenue_of_3.28B_In-Line”>More…
| Operations | Investing | Financing |
| 607 | -227 | 6 |
Balance Sheet Snapshot
Below shows the total assets, liabilities and book value per share for Gap. GAP_Reports_Non-GAAP_EPS_of_0.01_Beats_Estimates_by_0.17_Revenue_of_3.28B_In-Line”>More…
| Total Assets | Total Liabilities | Book Value Per Share |
| 11.39k | 9.15k | 6.1 |
Key Ratios Snapshot
Some of the financial key ratios for Gap are shown below. GAP_Reports_Non-GAAP_EPS_of_0.01_Beats_Estimates_by_0.17_Revenue_of_3.28B_In-Line”>More…
| 3Y Rev Growth | 3Y Operating Profit Growth | Operating Margin |
| -1.6% | -15.9% | -0.3% |
| FCF Margin | ROE | ROA |
| -0.5% | -1.3% | -0.3% |
Share Price
The company managed to beat analyst estimates by $0.17. In response to the news, GAP stock opened at $7.6 and closed at $7.4, down by 2.5% from last closing price of 7.6. Live Quote…
Analysis
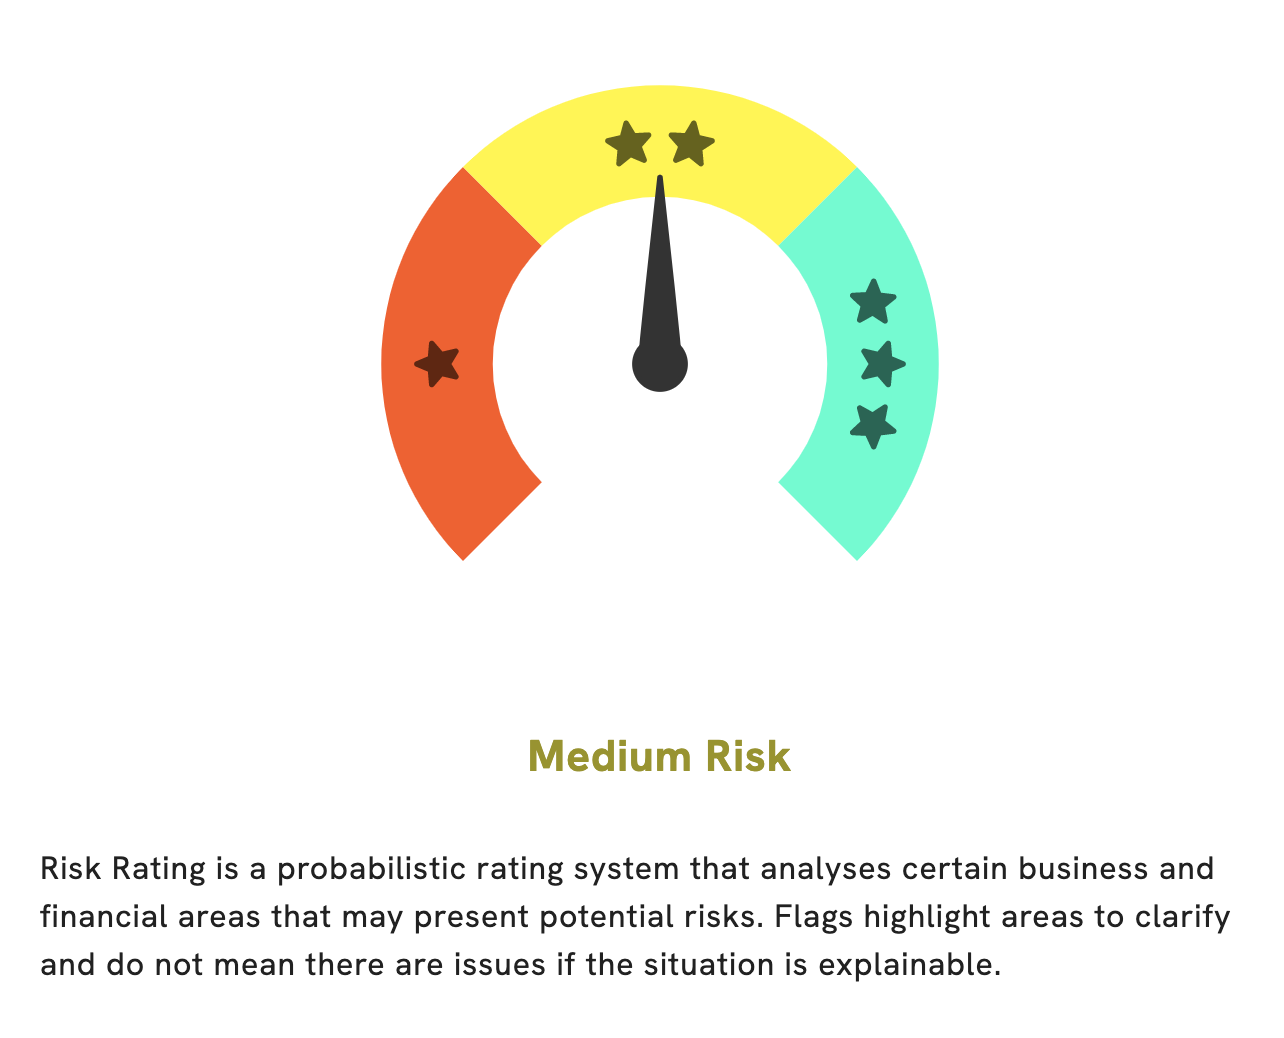
GoodWhale recently conducted an analysis on GAP‘s wellbeing in order to provide a Risk Rating for potential investors. The results showed that GAP is a medium risk investment in terms of financial and business aspects. This means that investors can expect an average return on their investment, but should also be aware of potential risks associated with the investment. Upon further inspection, GoodWhale has detected one risk warning in the company’s cashflow statement. If an investor would like to know more about this risk warning, they can register with us to gain access to our detailed analysis. It is important to keep in mind that all investments come with some form of risk, so it is important to fully understand all aspects of the investment before making a decision. More…
Peers
Gap Inc. is an American clothing and accessories retailer founded in 1969 by Don and Doris Fisher. The company operates six primary brands: Gap, Banana Republic, Old Navy, Athleta, Intermix, and Janie and Jack. Gap Inc. is headquartered in San Francisco, California. As of February 2019, Gap Inc. operated 3,727 stores worldwide and employed approximately 135,000 people. Abercrombie & Fitch Co. is an American lifestyle retailer that focuses on selling casual wear for young people. The company was founded in 1892 by David T. Abercrombie and Ezra Fitch and is headquartered in New Albany, Ohio. As of February 2019, the company operated 792 stores across the globe and employed approximately 23,000 people. The Children’s Place Inc. is an American children’s clothing retailer founded in 1969. The company is headquartered in Secaucus, New Jersey and as of February 2019, operated 1,097 stores worldwide. The company employs approximately 19,000 people. World Co Ltd is a Japanese retail company founded in 1949. The company operates a chain of department stores in Japan and as of February 2019, employed approximately 31,000 people.
– Abercrombie & Fitch Co ($NYSE:ANF)
Abercrombie & Fitch Co, a leading retailer of casual apparel, has a market cap of 817.96M as of 2022. The company’s ROE is 14.85%. Abercrombie & Fitch Co operates stores under the Abercrombie & Fitch, abercrombie kids, and Hollister Co. banners in the United States and internationally. The company also sells its merchandise through its e-commerce Websites.
– Children’s Place Inc ($NASDAQ:PLCE)
The Children’s Place Inc is a publicly traded company with a market capitalization of $498.72 million as of 2022. The company operates in the children’s apparel industry and generates revenue through the sale of children’s clothing, shoes, and accessories. The Children’s Place Inc has a return on equity of 55.72%. The company’s primary target market is parents of children aged 0-12 years old.
– World Co Ltd ($TSE:3612)
Suntech Power Holdings Co., Ltd. is a solar company. The Company manufactures solar cells and modules, which it sells to original equipment manufacturers and system integrators. Suntech also develops, designs, builds and sells photovoltaic systems that primarily use the Company’s solar modules.
Summary
Gap Inc. recently reported quarterly earnings with non-GAAP earnings per share (EPS) of $0.01, beating estimates by $0.17. Revenue for the quarter came in at $3.28B, which was in-line with analysts’ estimates. The positive earnings beat made investors optimistic and caused a surge in Gap’s stock price.
Investors will be watching closely to see if Gap can maintain their momentum in the coming quarters. Going forward, investors will also be assessing the company’s ability to execute on its strategies, such as its focus on digital transformation and potential expansion into new markets.
Related Posts


Recent Posts


