CARTER’S ACHIEVES Record-breaking Financial Results For Q2 2020
April 29, 2023

Trending News 🌥️
Their Non-GAAP earnings per share (EPS) of $0.98 exceeded expectations by an impressive $0.41, while their revenue of $695.9M surpassed estimates by a significant $47.32M. Since its beginning, the company has been dedicated to providing innovative, quality products to children and families around the world. With their recent record-breaking performance, CARTER’S ($NYSE:CRI) continues to demonstrate their commitment to providing superior products and services.
The strong financial results are a testament to the success of CARTER’S business model and the hard work of their employees. As the company continues to grow, it is clear that CARTER’S will remain a leader in the children’s apparel market for many years to come.
Stock Price
On Friday, CARTER’S opened at $71.4 and closed at $69.8, up 1.2% from its previous closing price of $68.9. Investors are optimistic about the future of CARTER’S, as the company has demonstrated strong financial performance and resilience throughout the year. With this impressive progress, CARTER’S is well-positioned to continue delivering outstanding value to shareholders. Live Quote…
About the Company
Income Snapshot
Below shows the total revenue, net income and net margin for Carter’s. More…
| Total Revenues | Net Income | Net Margin |
| 3.21k | 246.32 | 8.5% |
Cash Flow Snapshot
Below shows the cash from operations, investing and financing for Carter’s. More…
| Operations | Investing | Financing |
| 88.36 | -40.36 | -819.27 |
Balance Sheet Snapshot
Below shows the total assets, liabilities and book value per share for Carter’s. More…
| Total Assets | Total Liabilities | Book Value Per Share |
| 2.44k | 1.64k | 21.13 |
Key Ratios Snapshot
Some of the financial key ratios for Carter’s are shown below. More…
| 3Y Rev Growth | 3Y Operating Profit Growth | Operating Margin |
| -3.0% | -1.2% | 11.2% |
| FCF Margin | ROE | ROA |
| 1.5% | 28.4% | 9.2% |
Analysis
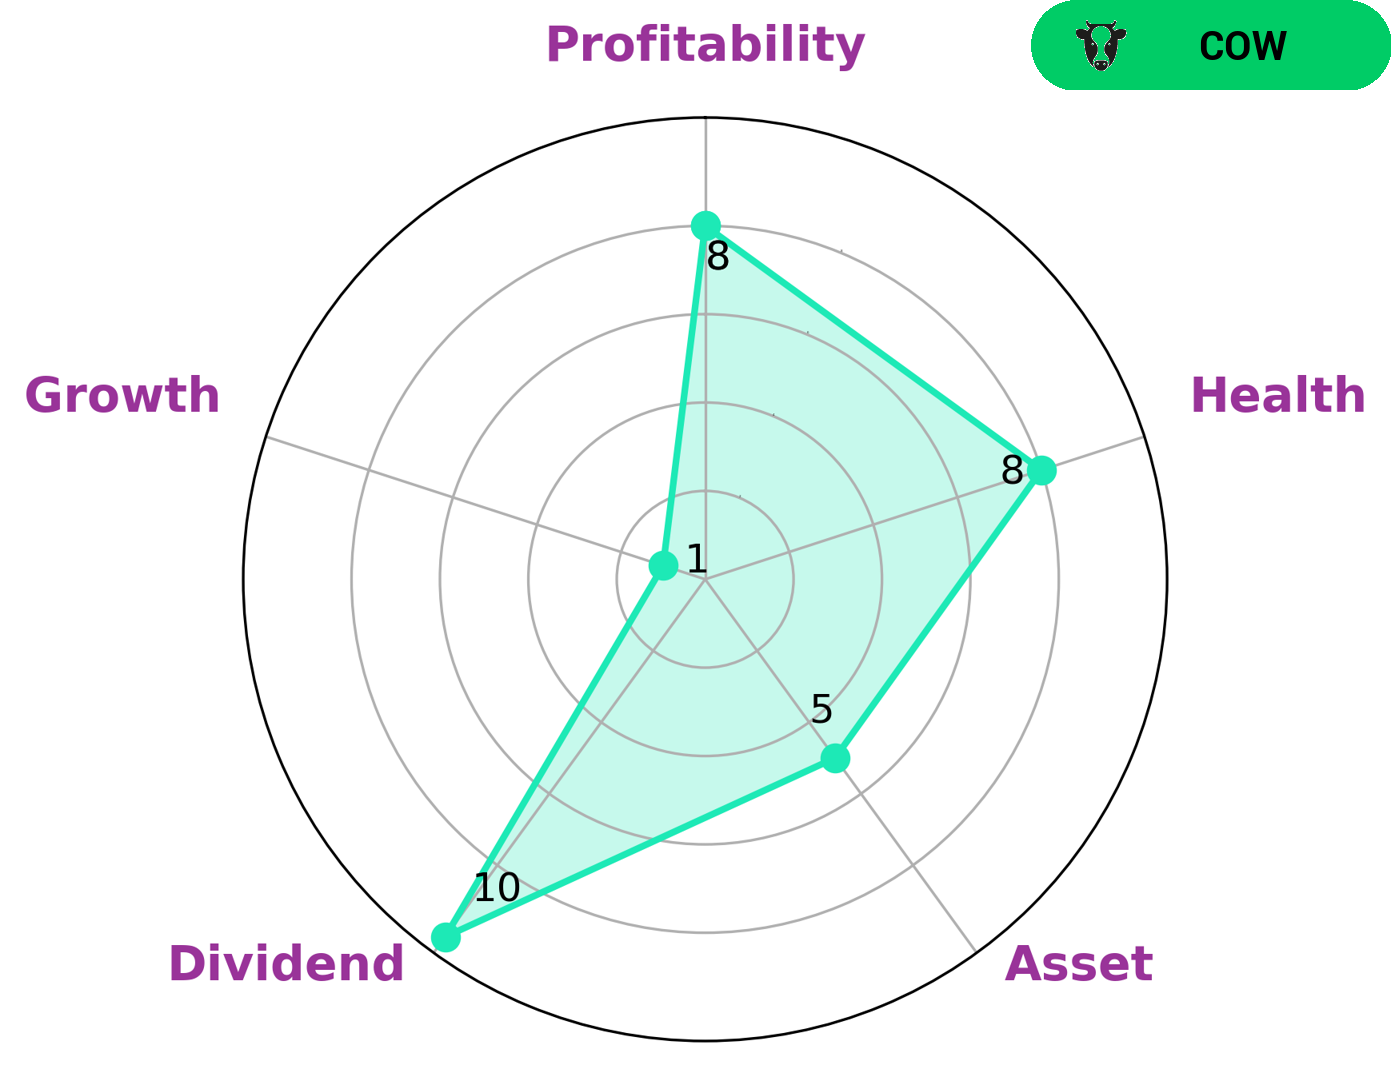
GoodWhale analysis of CARTER’S financials reveals a high health score of 8/10. This indicates that CARTER’S has a strong cashflow and debt capacity which can sustain it in times of crisis and keep operations secure. According to our Star Chart, CARTER’S belongs to the ‘Cow’ type of company, which are characterized by consistent and sustainable dividend payments. Given this, investors who aim to benefit from steady dividend payments may be interested in CARTER’S. Additionally, CARTER’S is strong in dividend and profitability, medium in asset, and weak in growth. These features may also draw investors seeking a balance between steady income yet some potential for growth. All of these factors make CARTER’S an attractive option for both short-term and long-term investors. More…
Peers
The company’s competitors include Children’s Place Inc, Apranga APB, and Boot Barn Holdings Inc.
– Children’s Place Inc ($NASDAQ:PLCE)
Children’s Place Inc is a publicly traded company with a market capitalization of 506.93M as of 2022. The company’s return on equity is 55.72%. Children’s Place Inc is a specialty retailer of children’s apparel and accessories. The company operates through two segments: North America and Europe. Children’s Place Inc offers a variety of merchandise, including clothing, footwear, accessories, and gifts. The company was founded in 1969 and is headquartered in Secaucus, New Jersey.
– Apranga APB ($LTS:0KJF)
As of 2022, Apranga APB has a market cap of 103.12M. The company’s return on equity is 19.95%. Apranga APB is a Lithuanian clothing retail chain. The company was founded in 1989 and is headquartered in Vilnius, Lithuania. Apranga APB operates in Lithuania, Latvia, and Estonia. The company operates a chain of stores under the Apranga and APB brands. Apranga APB offers a range of clothing, footwear, and accessories for men, women, and children.
– Boot Barn Holdings Inc ($NYSE:BOOT)
As of 2022, Boot Barn Holdings Inc has a market cap of 1.71B and a Return on Equity of 23.87%. The company is a retailer of western and work-related footwear, apparel, and accessories for men, women, and children.
Summary
These results are a positive sign for investors looking to invest in CARTER’S, as the company has delivered strong financial performance. Analysts will be closely following CARTER’S moving forward to see if these results can be sustained.
Related Posts


Recent Posts


Investing Everyone Can Do.
Investing shouldn’t be exclusive to a select few. We believe everyone should have the opportunity to grow their wealth. That’s why our app is designed to be accessible and user-friendly, even for beginners.
