Under Armour Intrinsic Value Calculator – Under Armour Cl A Stock Struggles on Friday Compared to Competitors
January 4, 2024

🌧️Trending News
Friday saw Under Armour ($NYSE:UAA) Inc. Cl A stock struggling compared to its competitors. This is a bit of a disappointment for the company, considering that Under Armour is one of the world’s leading sports apparel and footwear companies. On Friday, however, Under Armour’s stock failed to keep up with the rest of the market, closing down more than 1% for the day while other companies in its sector either rose or stayed flat. While it’s unclear what caused the underperformance, some analysts believe that investors may have been spooked by the company’s latest earnings report, which showed a decline in sales and profits.
The company is now taking steps to turn its fortunes around, with plans to launch new products and marketing campaigns. It remains to be seen if these efforts will be enough to bring Under Armour’s stock back to its former glory. In the meantime, investors will be keeping a close eye on the company as it continues to try and revive its fortunes.
Market Price
On Friday, shares of UNDER ARMOUR Inc. Cl A (UAA) were struggling, closing down 1.3% from the prior closing price of 8.8 at $8.7. This was a stark contrast to its competitors, who witnessed modest gains on the same day. The drop in UNDER ARMOUR’s stock may have been caused by investor skepticism over the company’s performance and prospects.
In recent months, the stock has been volatile due to a variety of factors including sales declines, layoffs, and management shakeups. As the company attempts to restructure and right the ship, it remains to be seen whether shareholders will gain confidence in the company’s future. Live Quote…
About the Company
Income Snapshot
Below shows the total revenue, net income and net margin for Under Armour. More…
| Total Revenues | Net Income | Net Margin |
| 5.86k | 410.32 | 7.0% |
Cash Flow Snapshot
Below shows the cash from operations, investing and financing for Under Armour. More…
| Operations | Investing | Financing |
| 56.83 | -133.08 | -128.12 |
Balance Sheet Snapshot
Below shows the total assets, liabilities and book value per share for Under Armour. More…
| Total Assets | Total Liabilities | Book Value Per Share |
| 4.75k | 2.66k | 4.77 |
Key Ratios Snapshot
Some of the financial key ratios for Under Armour are shown below. More…
| 3Y Rev Growth | 3Y Operating Profit Growth | Operating Margin |
| 2.5% | -14.7% | 5.1% |
| FCF Margin | ROE | ROA |
| -2.1% | 9.1% | 3.9% |
Analysis – Under Armour Intrinsic Value Calculator
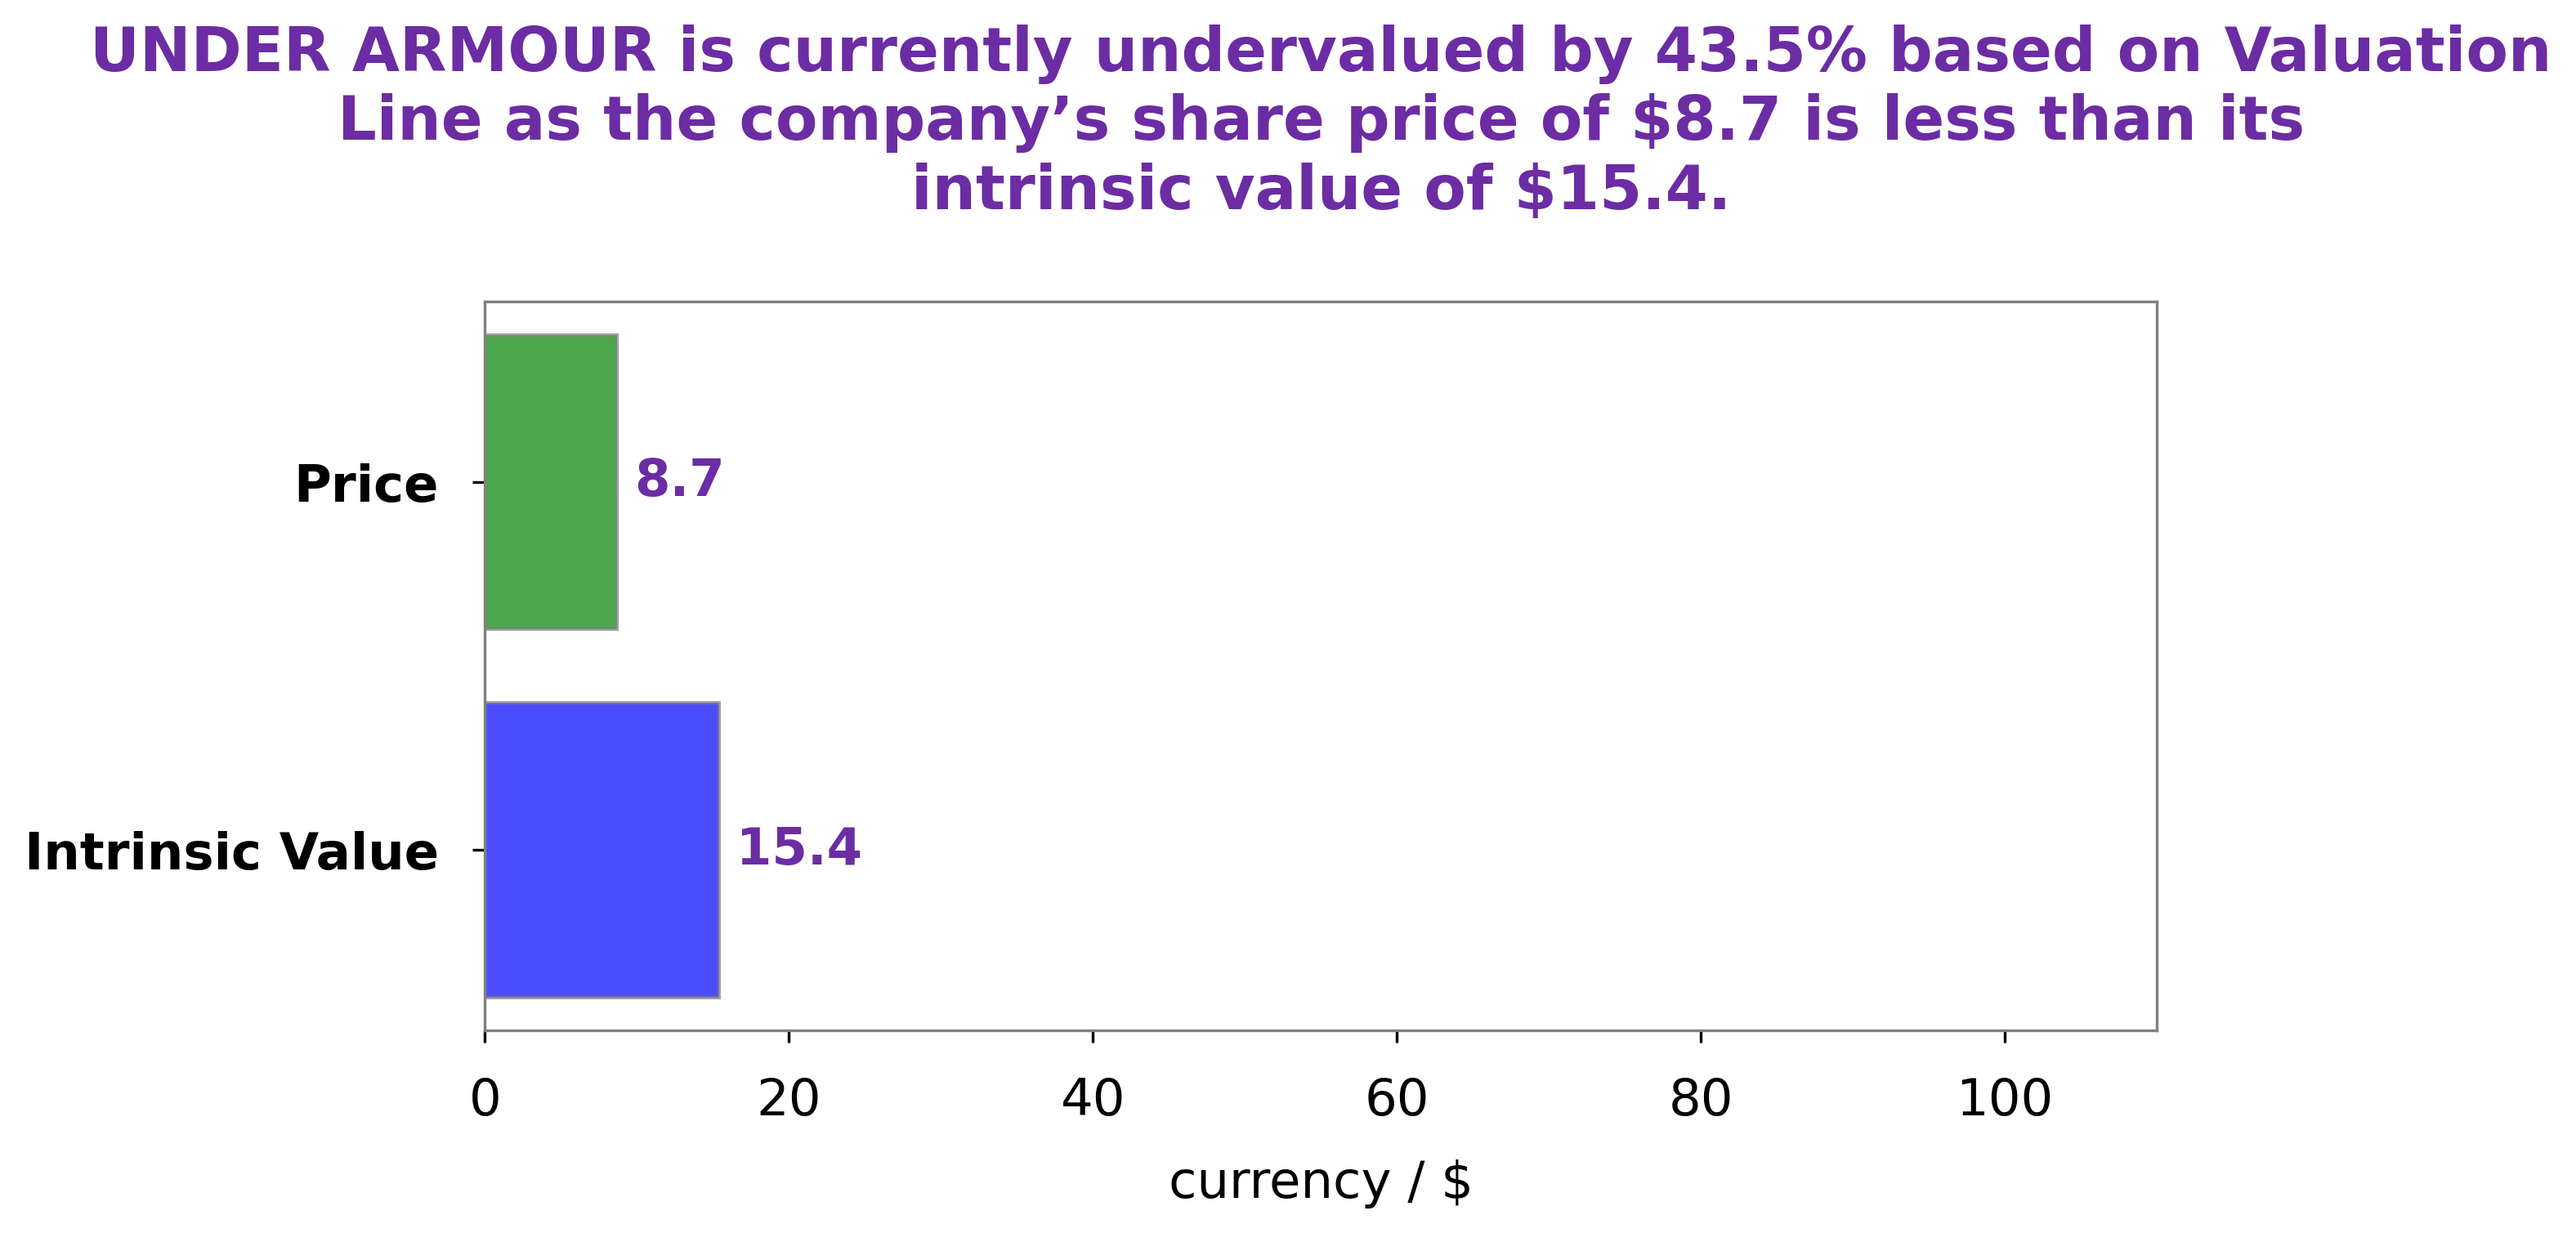
At GoodWhale, we have thoroughly examined the fundamentals of UNDER ARMOUR. Our proprietary Valuation Line has calculated the fair value of UNDER ARMOUR share to be around $15.4. Currently, UNDER ARMOUR stock is trading at $8.7, which means it is undervalued by 43.5%. Therefore, we recommend investors to buy UNDER ARMOUR stocks as it is currently trading at a discounted price. More…
Peers
Under Armour, Inc. is an American company that manufactures footwear, sports, and casual apparel. Founded in 1996 by Kevin Plank, a former University of Maryland football player, Under Armour is the second-largest sportswear manufacturer in the United States. UA’s competitors include Nike, Lululemon Athletica, and Capri Holdings.
– Nike Inc ($NYSE:NKE)
Nike Inc is a publicly traded company with a market capitalization of 137.7 billion as of 2022. The company has a return on equity of 25.1%. Nike is a designer, manufacturer, and marketer of athletic footwear, apparel, equipment, and accessories. The company’s products are sold in over 190 countries worldwide. Nike has endorsement deals with some of the world’s most popular athletes, including LeBron James, Cristiano Ronaldo, and Tiger Woods.
– Lululemon Athletica Inc ($NASDAQ:LULU)
Lululemon Athletica Inc. is a Canadian athletic apparel retailer. The company was founded in 1998 by Chip Wilson and is headquartered in Vancouver, British Columbia. Lululemon Athletica Inc. designs, manufactures and markets athletic apparel and accessories for women, men and girls. The company’s product line includes pants, shorts, tops, jackets, hoodies, and accessories such as bags, socks, and headwear. Lululemon Athletica Inc. also operates a website and provides online shopping services. As of 2022, the company’s market cap is $37.96 billion and its ROE is 34.51%.
– Capri Holdings Ltd ($NYSE:CPRI)
Capri Holdings Ltd is a fashion company with a market cap of 5.96B as of 2022. The company has a Return on Equity of 25.1%. Capri Holdings Ltd is a luxury fashion company that owns and operates a portfolio of iconic fashion brands, including Michael Kors, Versace, and Jimmy Choo. The company’s brands are available in more than 100 countries through a network of company-operated stores, licensed stores, and e-commerce sites.
Summary
Under Armour Inc. (UA) is a leader in the apparel and accessories industry, but the company’s stock underperformed on Friday. Analysts attribute this to the overall economic climate, as well as to the company’s recent struggles to penetrate new markets. Investors are concerned that UA’s growth has been slowing and that its strategy for long-term profitability is unclear. As a result, short-term gains may be limited and investors should be cautious when considering investing.
Analysts suggest that investors should conduct thorough research before investing in UA, including a review of the company’s financial statements and current competitive landscape. They also recommend keeping an eye on the company’s strategic ventures and its progress in new markets. In the long run, if UA can successfully diversify and capitalize on trends, it could prove to be a good investment for investors.
Related Posts


Recent Posts


Investing Everyone Can Do.
Investing shouldn’t be exclusive to a select few. We believe everyone should have the opportunity to grow their wealth. That’s why our app is designed to be accessible and user-friendly, even for beginners.
