Hanesbrands Inc Intrinsic Value Calculation – HANESBRANDS INC Reports FY2023 Q2 Earnings with Total Revenue of USD 1439.0 Million, Down 4.9% Year-on-Year
August 16, 2023

🌥️Earnings Overview
HANESBRANDS ($NYSE:HBI): HanesBrands Inc. has reported their Q2 FY2023 earnings ending June 30th 2023, revealing a total revenue of USD 1439.0 million, a decrease of 4.9% compared to the same period in the prior year. Net income was reported as USD -22.5 million, significantly lower than the figure of 92.1 million seen in the same period last year.
Analysis – Hanesbrands Inc Intrinsic Value Calculation
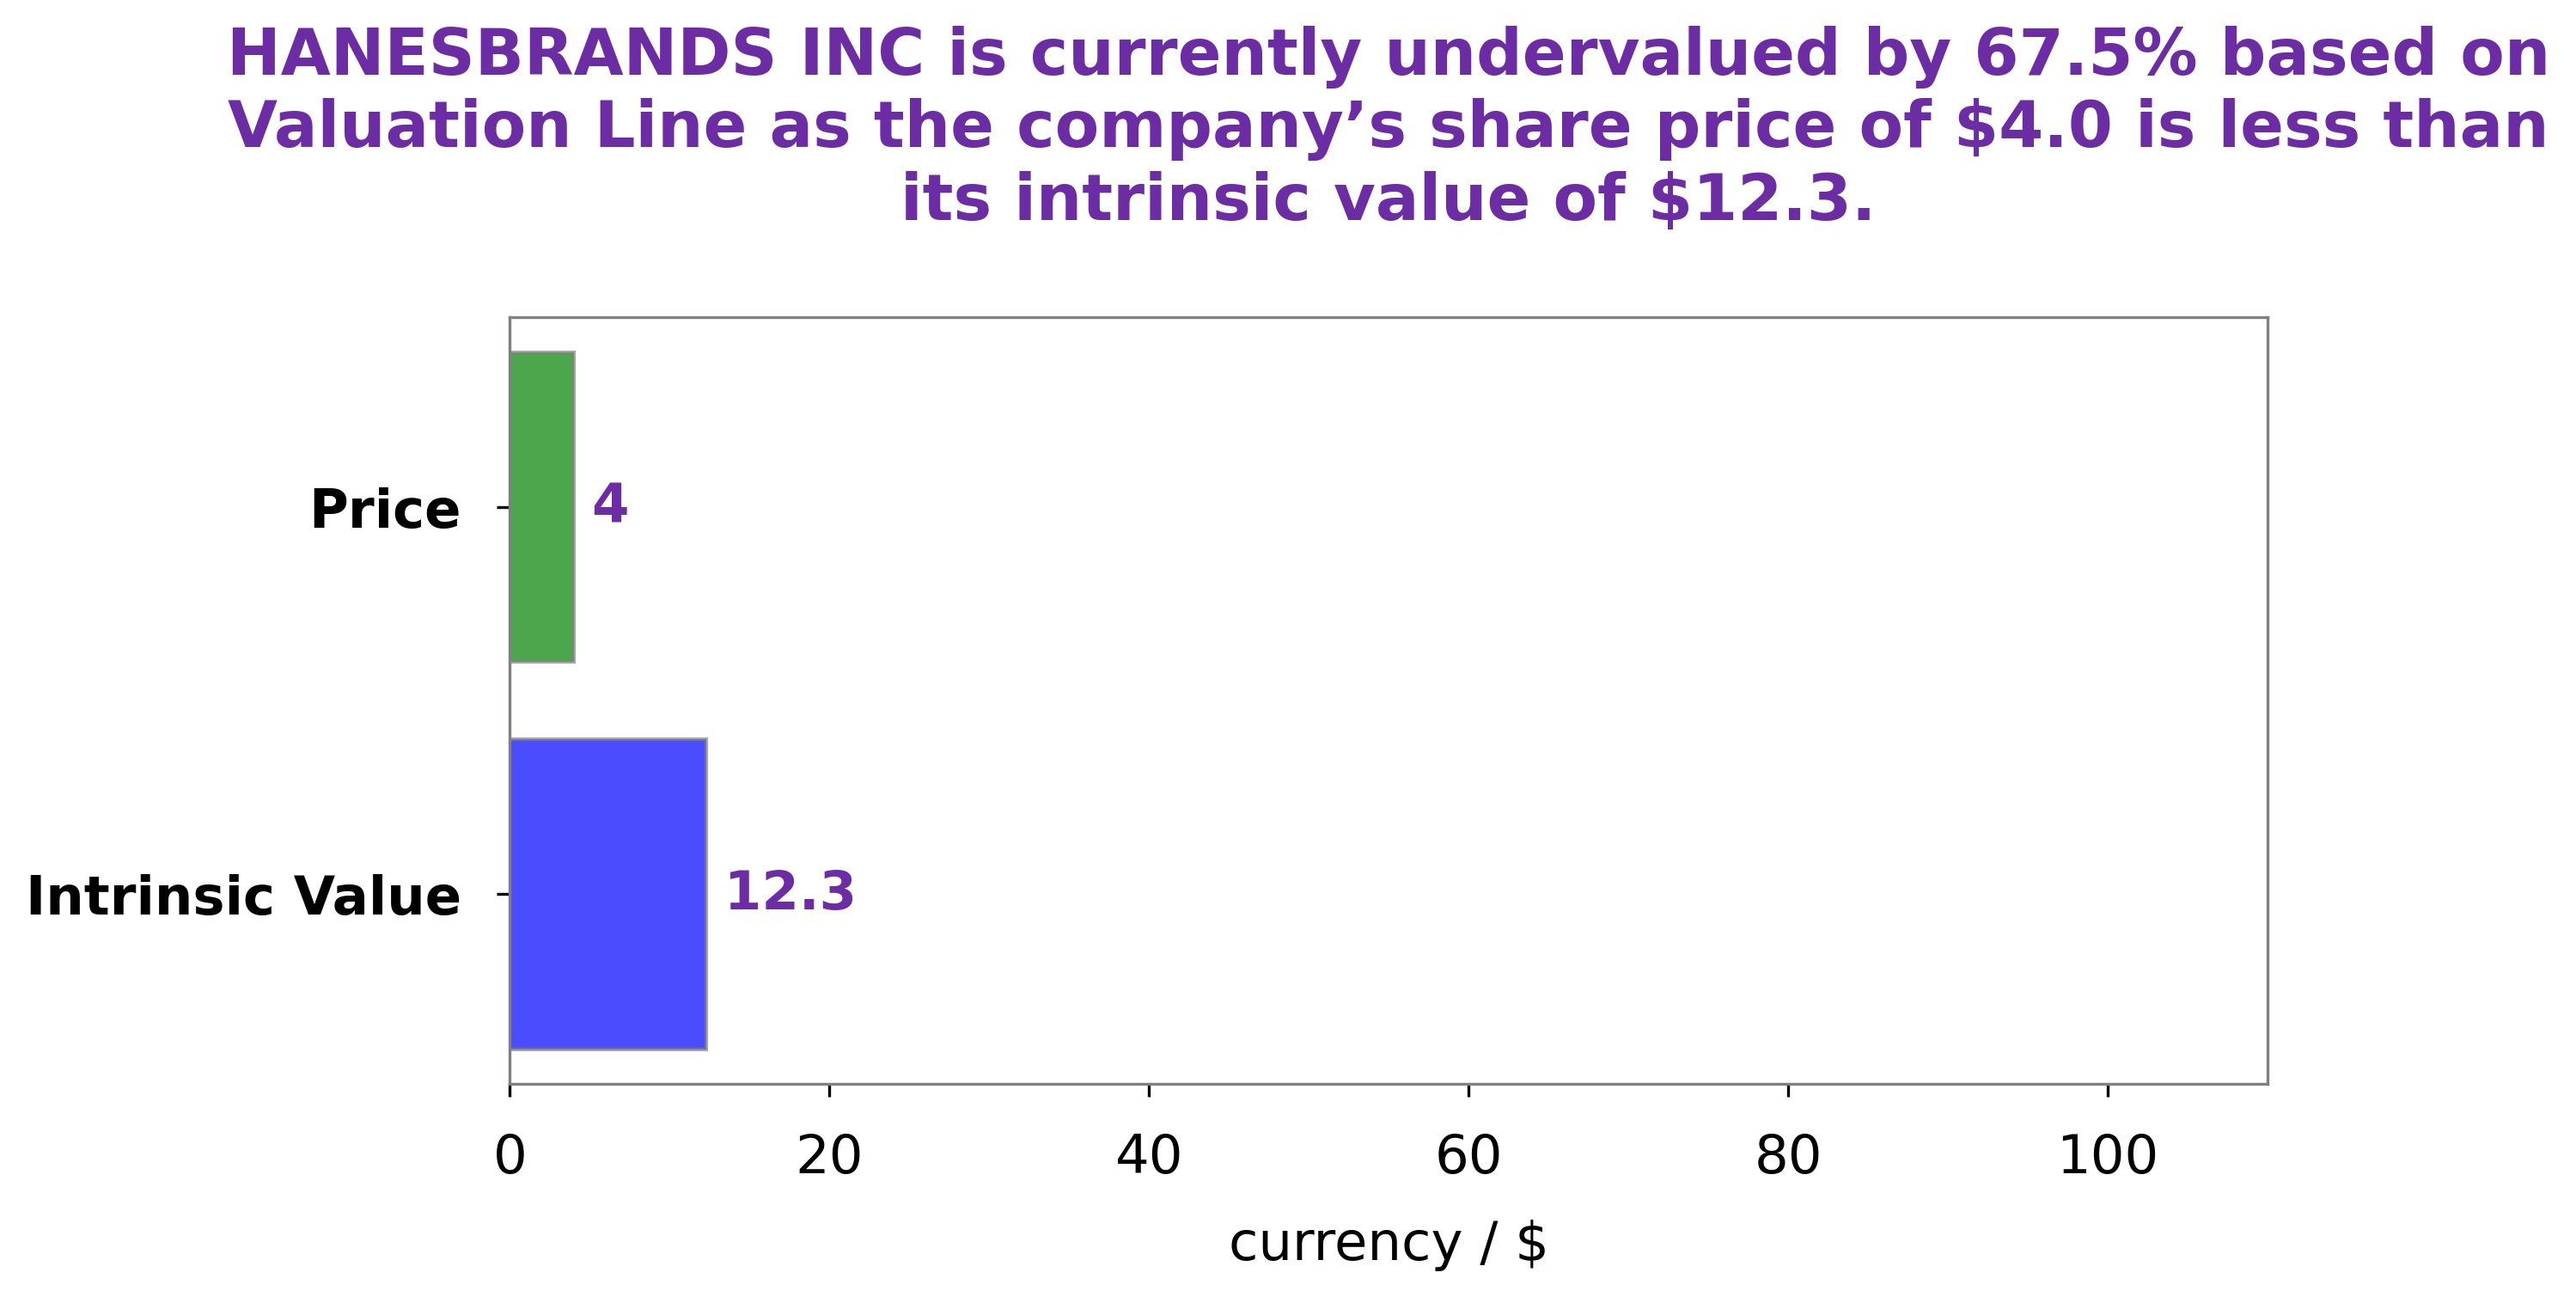
GoodWhale conducted an in-depth analysis of HANESBRANDS INC‘s wellbeing, and our proprietary Valuation Line was used to calculate its intrinsic value. The results of this analysis showed that the intrinsic value of a HANESBRANDS INC share is around $11.9. This means that the stock is currently traded at $5.3; a full 55.4% lower than its true value. This presents a unique opportunity for investors, as HANESBRANDS INC stock is currently undervalued, which could result in a higher return on investment than other options. More…
About the Company
Income Snapshot
Below shows the total revenue, net income and net margin for Hanesbrands Inc. More…
| Total Revenues | Net Income | Net Margin |
| 5.97k | -394.88 | -6.6% |
Cash Flow Snapshot
Below shows the cash from operations, investing and financing for Hanesbrands Inc. More…
| Operations | Investing | Financing |
| 214.5 | -84.59 | -183.64 |
Balance Sheet Snapshot
Below shows the total assets, liabilities and book value per share for Hanesbrands Inc. More…
| Total Assets | Total Liabilities | Book Value Per Share |
| 6.28k | 5.93k | 0.99 |
Key Ratios Snapshot
Some of the financial key ratios for Hanesbrands Inc are shown below. More…
| 3Y Rev Growth | 3Y Operating Profit Growth | Operating Margin |
| -3.6% | -25.2% | 5.0% |
| FCF Margin | ROE | ROA |
| 1.8% | 54.5% | 3.0% |
Peers
Hanesbrands Inc is an American clothing company with a range of clothing products including underwear, socks, and t-shirts. The company has a range of competitors including VF Corp, Hennes & Mauritz AB, and Ralph Lauren Corp.
– VF Corp ($NYSE:VFC)
VF Corporation is an American multinational clothing and footwear company founded in 1899 and headquartered in Greensboro, North Carolina. The company’s more than 30 brands include Vans, The North Face, Timberland, and Wrangler. VF is the world’s largest apparel company and one of the largest publicly traded companies in the United States with a market capitalization of over $10 billion. The company’s return on equity is 22.53%.
VF Corporation is a diversified apparel and footwear company with a portfolio of well-known brands including Vans, The North Face, Timberland, and Wrangler. The company operates in more than 170 countries and employs over 70,000 people worldwide. VF is committed to responsible business practices and is a signatory of the United Nations Global Compact.
– Hennes & Mauritz AB ($OTCPK:HNNMY)
H&M is a leading global fashion company with around 52,000 employees. The company’s business concept is to offer fashion and quality at the best price in a sustainable way. H&M has been listed on Nasdaq Stockholm since 1974.
– Ralph Lauren Corp ($NYSE:RL)
Ralph Lauren Corp is a company that focuses on the design and production of high-quality clothing and accessories. The company has a market cap of 6.28B as of 2022 and a return on equity of 19.37%. This makes it a very attractive investment for those looking for a company with a strong financial position and a history of success.
Summary
Hanesbrands Inc. has reported its earnings for Q2 of 2023, with total revenue of USD 1439.0 million, a decline of 4.9% from the same period in the previous year. Net income declined to a negative USD 22.5 million, compared to USD 92.1 million the year before. For potential investors, Hanesbrands Inc. appears to be facing challenging times due to the decrease in revenue and net income. Nevertheless, with the company’s long history of success and a strong balance sheet, investors may consider taking a closer look at the company’s financials to make an informed decision before investing.
Related Posts


Recent Posts


Investing Everyone Can Do.
Investing shouldn’t be exclusive to a select few. We believe everyone should have the opportunity to grow their wealth. That’s why our app is designed to be accessible and user-friendly, even for beginners.
