Tessenderlo Group dividend calculator – Tessenderlo Group NV Declares 0.75 Cash Dividend
June 11, 2023

🌥️Dividends Yield
On May 26 2023, Tessenderlo Group ($BER:TEZ) NV declared a 0.75 cash dividend. This marks the second consecutive year that the company has paid out dividends, with 0.0 EUR and 0.0 EUR per share over the last two years. This dividend yield measures 5.69% for the period from 2022 to 2023, making it an attractive option for investors seeking dividend stocks. The ex-dividend date is May 31, 2023, so investors must purchase the stock before this date in order to receive the dividend.
Tessenderlo Group NV has a globally diversified portfolio of chemical and industrial products, and is one of the leading producers of process chemicals and specialty chemicals in Europe. Its products are used in a variety of industries, including agriculture, mining, water treatment, and food processing. With an average dividend yield of 5.69%, Tessenderlo Group could be an attractive option for investors looking for dividend stocks.
Stock Price
This marks the seventh consecutive year that the company has paid out a dividend. The news had a positive effect on the company’s stock price, which opened at €29.7 and closed at the same price, representing a 0.7% increase from the prior closing price of €29.5. Analysts and investors have reacted positively to the company’s decision to declare a dividend, citing it as a sign of their commitment to good corporate governance and shareholder returns. Live Quote…
About the Company
Income Snapshot
Below shows the total revenue, net income and net margin for Tessenderlo Group. More…
| Total Revenues | Net Income | Net Margin |
| 2.59k | 226.9 | 10.1% |
Cash Flow Snapshot
Below shows the cash from operations, investing and financing for Tessenderlo Group. More…
| Operations | Investing | Financing |
| 199.8 | -194 | -171.8 |
Balance Sheet Snapshot
Below shows the total assets, liabilities and book value per share for Tessenderlo Group. More…
| Total Assets | Total Liabilities | Book Value Per Share |
| 2.3k | 897.6 | 32.51 |
Key Ratios Snapshot
Some of the financial key ratios for Tessenderlo Group are shown below. More…
| 3Y Rev Growth | 3Y Operating Profit Growth | Operating Margin |
| 14.1% | 34.4% | 11.5% |
| FCF Margin | ROE | ROA |
| 3.3% | 13.5% | 8.1% |
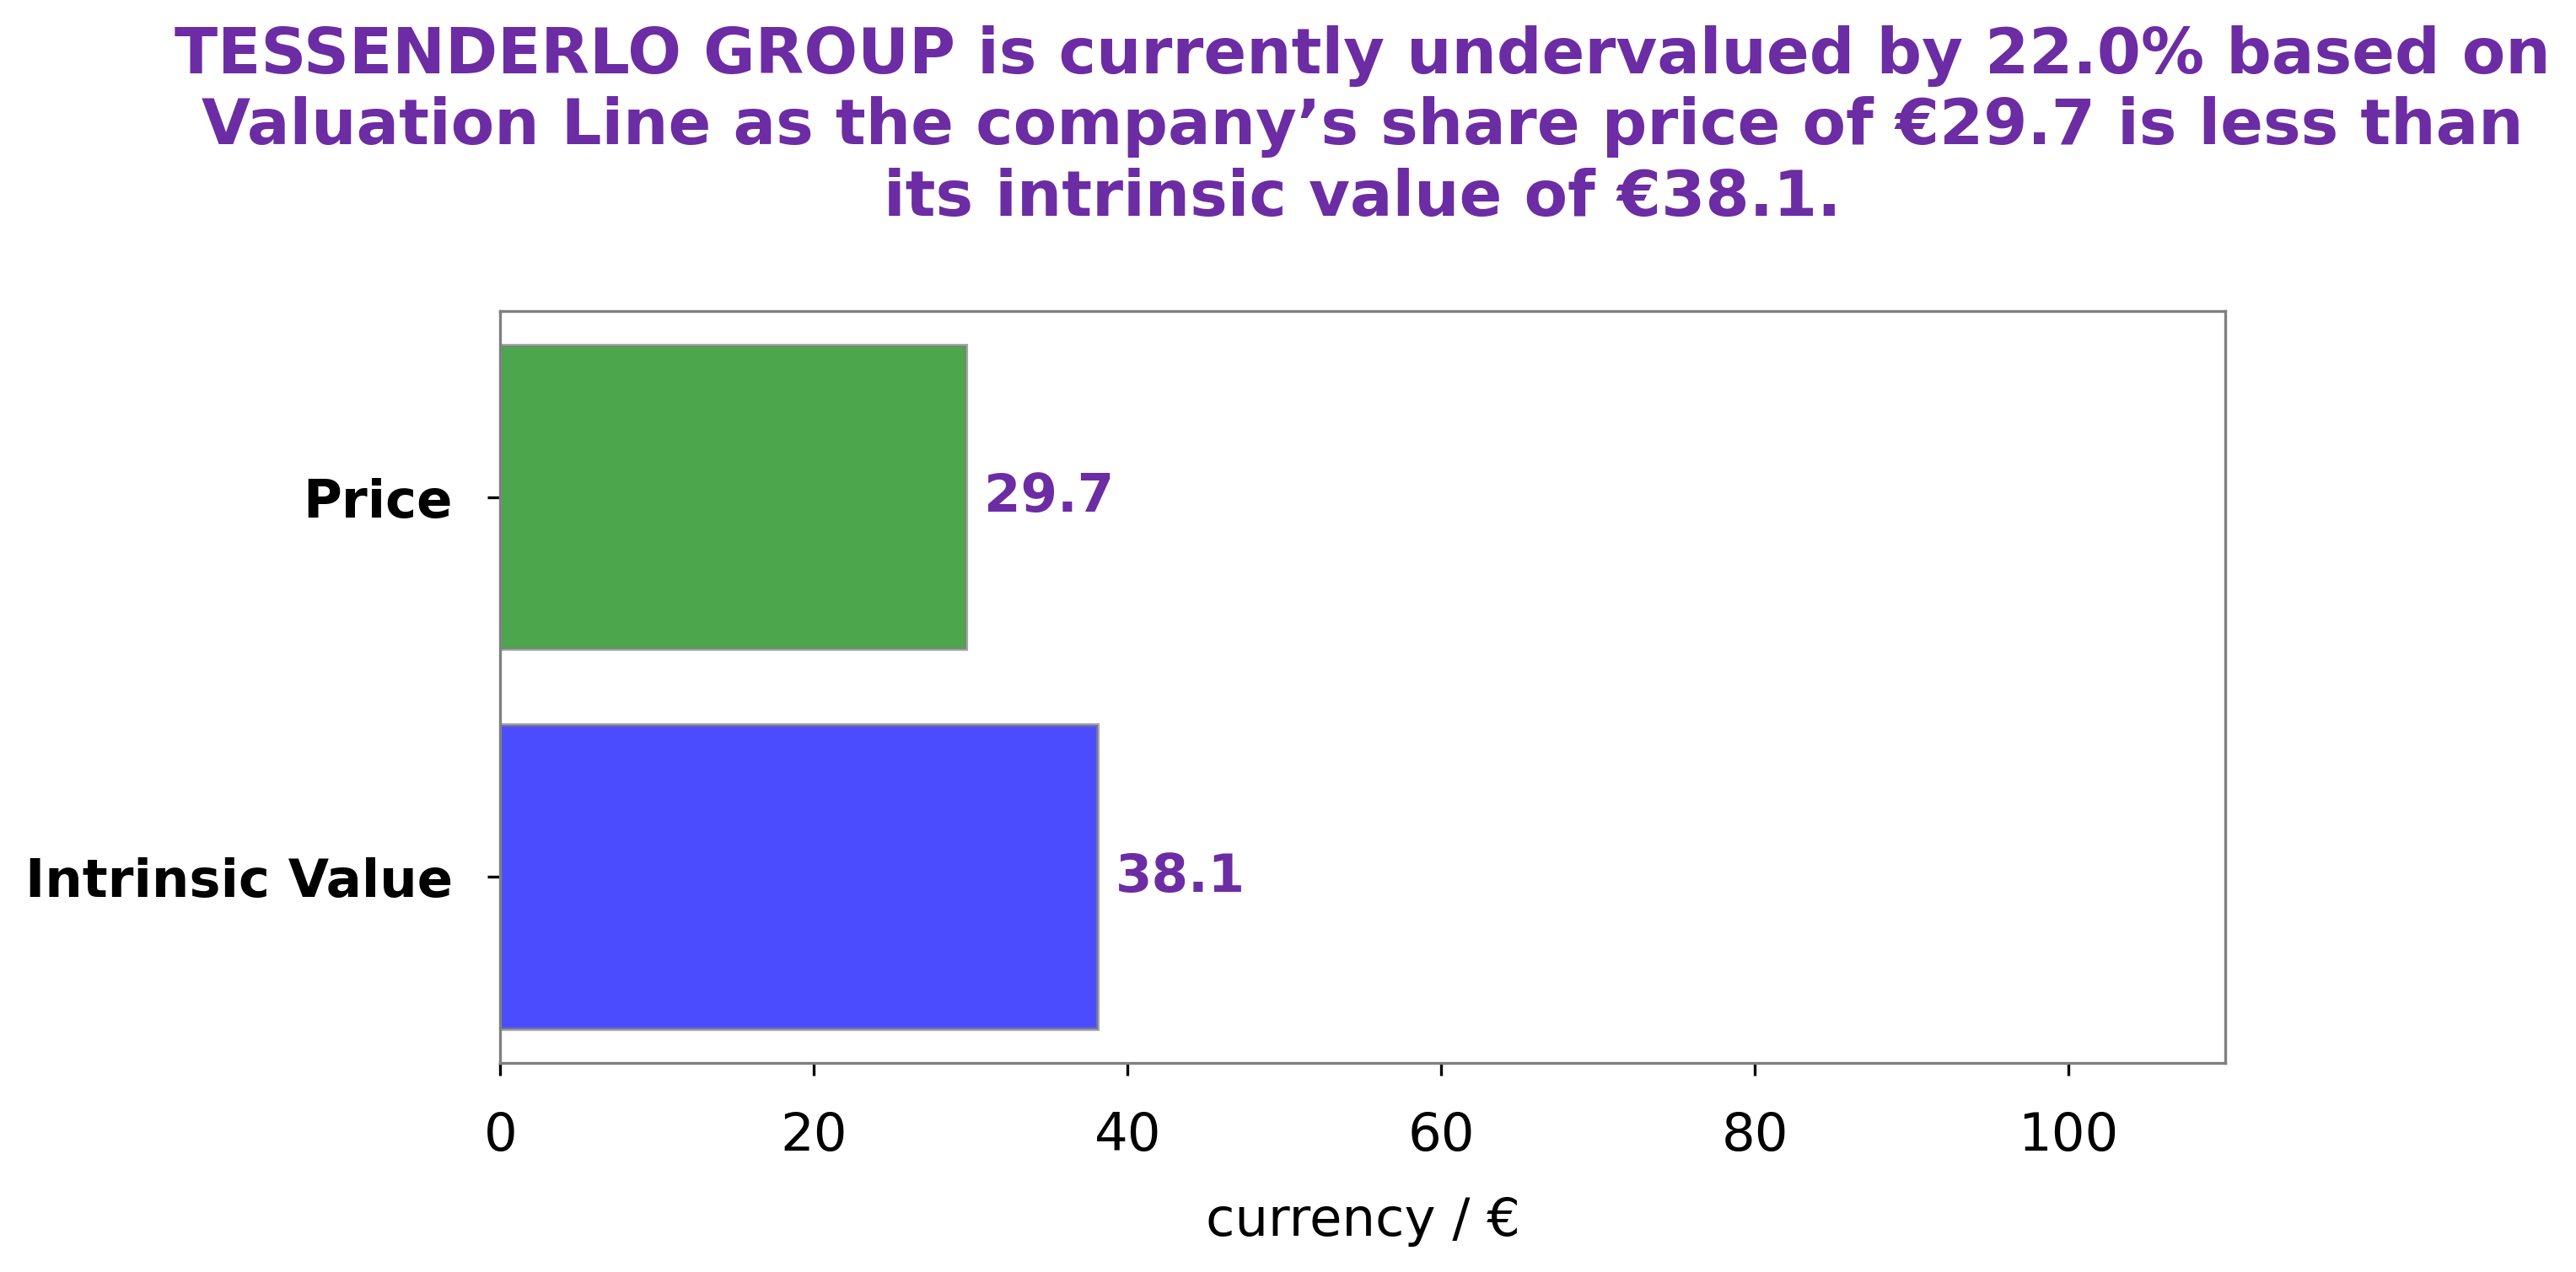
Analysis – Tessenderlo Group Stock Intrinsic Value
At GoodWhale, we conducted an analysis of TESSENDERLO GROUP‘s wellbeing. Through our proprietary Valuation Line, we have calculated that the intrinsic value of TESSENDERLO GROUP shares is currently €38.1. However, currently, the stock of TESSENDERLO GROUP is being traded at €29.7, which is an undervaluation of 22.0%. This discrepancy presents an opportunity for potential investors to consider. More…
Summary
TESSENDERLO GROUP is an attractive option for dividend-seeking investors, providing 0.0 and 0.0 EUR dividends per share over the last two years with an average dividend yield of 5.69%. With an increasing focus on sustainability and innovation, TESSENDERLO GROUP is well-positioned to deliver potential long-term returns. Furthermore, the company boasts various competitive advantages, such as a wide geographic presence and a diverse portfolio of products and services. With a strong financial position, TESSENDERLO GROUP presents a potential opportunity for investors looking to add a steady income stream to their portfolio.
Related Posts


Recent Posts


Investing Everyone Can Do.
Investing shouldn’t be exclusive to a select few. We believe everyone should have the opportunity to grow their wealth. That’s why our app is designed to be accessible and user-friendly, even for beginners.
