Fmc Corporation Stock Intrinsic Value – FMC CORPORATION Reports Second Quarter Earnings Results for Fiscal Year 2023
August 5, 2023

🌥️Earnings Overview
On August 2, 2023, FMC CORPORATION ($NYSE:FMC) announced their earnings results for the second quarter of fiscal year 2023 (ending June 30, 2023). Revenue for the period dropped by 30.1%, amounting to USD 1014.5 million, and net income decreased by 77.3%, reaching USD 30.5 million compared to the same period in the prior year.
Stock Price
The stock opened at $93.2 and closed at $92.8, indicating a 1.3% decrease from its previous closing price of 94.0. This modest decrease in price can be attributed to the quarterly earnings report, which showed a slight decline in net earnings compared to the previous quarter. The company’s financials also revealed a decrease in operating income from the prior quarter. This was largely due to a rise in expenses associated with research and development, as well as higher selling, general and administrative costs.
Additionally, the company experienced a slight dip in revenue, primarily due to a decrease in sales of its specialty chemical products. Despite the minor losses in the quarter, FMC CORPORATION remains confident in their overall performance, as they continue to invest heavily in expanding their product offerings and boosting their presence in international markets. They also remain optimistic that their strong portfolio of products and their technical capabilities will help them achieve long-term success. Live Quote…
About the Company
Income Snapshot
Below shows the total revenue, net income and net margin for Fmc Corporation. More…
| Total Revenues | Net Income | Net Margin |
| 5.36k | 620.3 | 13.2% |
Cash Flow Snapshot
Below shows the cash from operations, investing and financing for Fmc Corporation. More…
| Operations | Investing | Financing |
| 269.2 | -266.4 | 371.5 |
Balance Sheet Snapshot
Below shows the total assets, liabilities and book value per share for Fmc Corporation. More…
| Total Assets | Total Liabilities | Book Value Per Share |
| 11.95k | 8.57k | 27.76 |
Key Ratios Snapshot
Some of the financial key ratios for Fmc Corporation are shown below. More…
| 3Y Rev Growth | 3Y Operating Profit Growth | Operating Margin |
| 5.1% | 5.5% | 19.3% |
| FCF Margin | ROE | ROA |
| 3.7% | 18.6% | 5.4% |
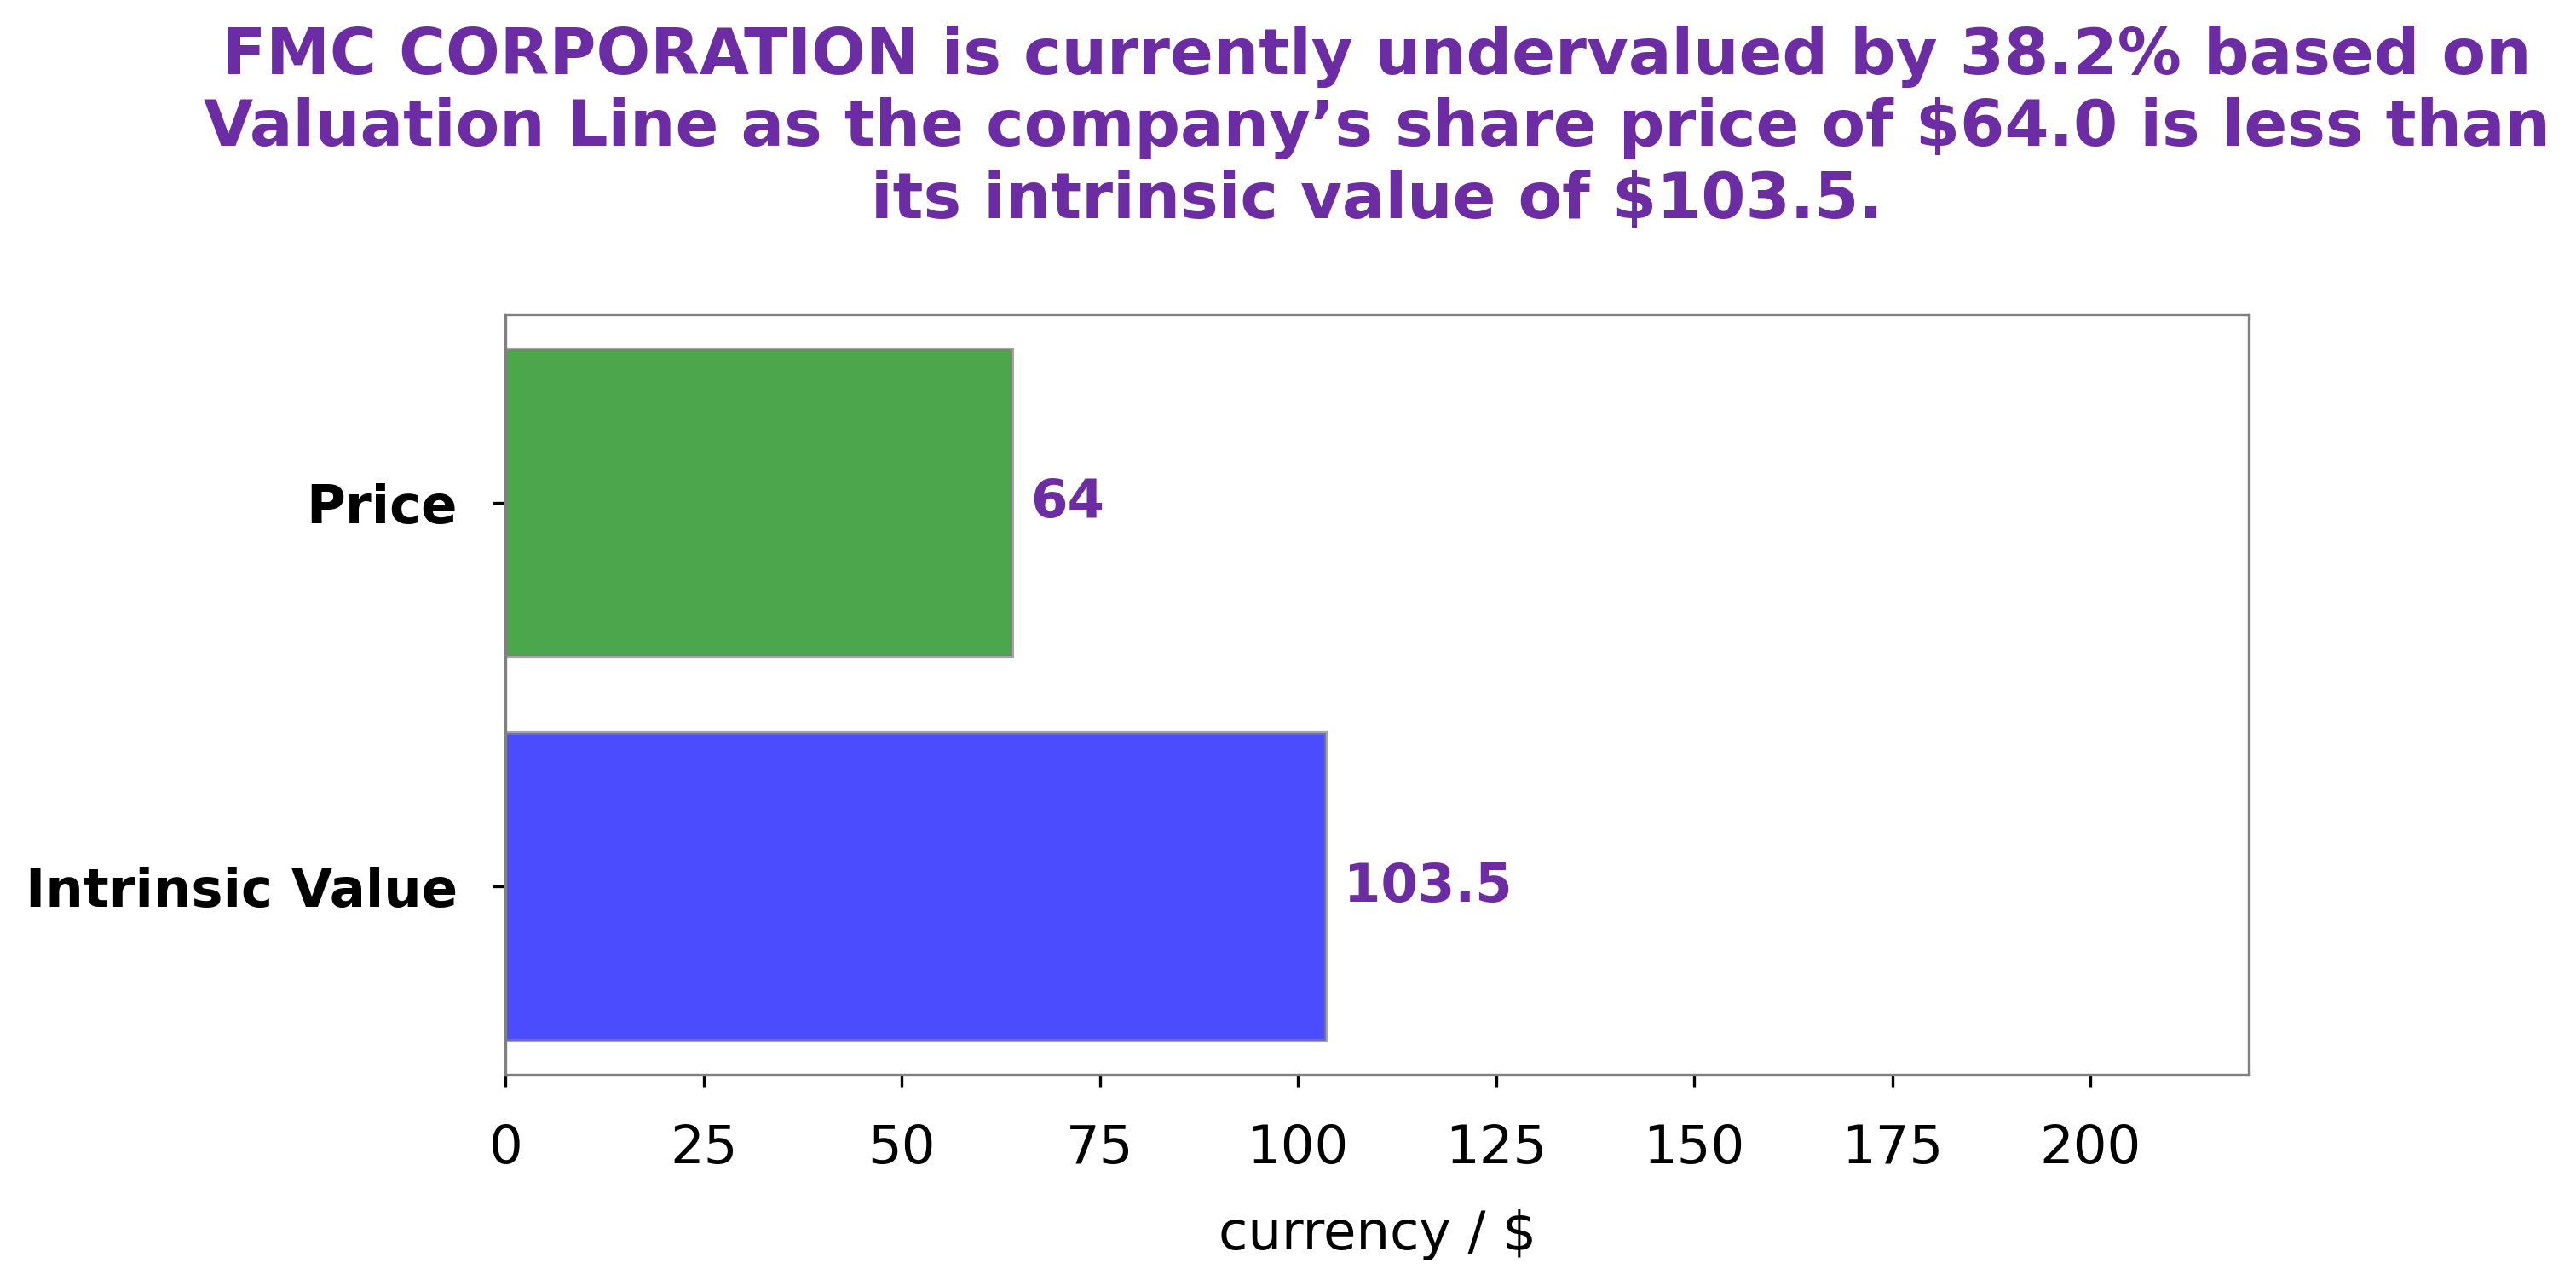
Analysis – Fmc Corporation Stock Intrinsic Value
At GoodWhale, we have conducted an analysis of FMC CORPORATION‘s wellbeing. Our proprietary Valuation Line calculated the fair value of FMC CORPORATION share to be around $127.9. Currently, however, FMC CORPORATION stock is traded at $92.8, which is undervalued by 27.4%. This presents investors with a great opportunity to invest in FMC CORPORATION as they are able to purchase stocks at a much lower cost than its actual worth. We believe that this makes FMC CORPORATION a great investment opportunity and encourage potential investors to seize this opportunity. More…
Peers
The company competes with other chemical companies such as Anhui Liuguo Chemical Co Ltd, Shandong Hualu-hengsheng Chemical Co Ltd, and Shandong Weifang Rainbow Chemical Co Ltd.
– Anhui Liuguo Chemical Co Ltd ($SHSE:600470)
Anhui Liuguo Chemical Co Ltd is a Chinese chemical company with a market cap of 3.31B as of 2022. The company has a Return on Equity of 15.93%. Liuguo Chemical is engaged in the manufacture and sale of chemical products. The company’s products are used in the textile, food, and pharmaceutical industries.
– Shandong Hualu-hengsheng Chemical Co Ltd ($SHSE:600426)
Shandong Hualu-hengsheng Chemical Co Ltd is a chemical company that produces and sells a variety of chemicals. The company has a market capitalization of 61.05 billion as of 2022 and a return on equity of 23.83%. The company’s products include organic and inorganic chemicals, dyestuffs, pigments, and other chemicals.
– Shandong Weifang Rainbow Chemical Co Ltd ($SZSE:301035)
Shandong Weifang Rainbow Chemical Co Ltd is a market leader in the production of dyes and pigments. The company has a strong market share in China and its products are sold in over 50 countries around the world. Rainbow Chemical is a publicly traded company with a market capitalization of over 26 billion US dollars as of 2022. The company has a strong return on equity of 19.47%. Rainbow Chemical is a vertically integrated manufacturer of dyes and pigments with a complete value chain from manufacturing to marketing. The company has a comprehensive product portfolio that covers all major applications in the dyestuff and pigment industry. Rainbow Chemical is committed to sustainable development and has a strong focus on environmental, health, and safety.
Summary
FMC Corporation reported their second quarter financial results for the period ending June 30, 2023. Total revenue was USD 1014.5 million, a decrease of 30.1% compared to the same period last year. Net income for the quarter was USD 30.5 million, a 77.3% decrease from the prior year. Investors may be concerned at the declining revenues and net income, however FMC Corporation’s strong cash position on its balance sheet could provide reassurance.
It is unclear if the decrease in revenue and earnings is a short-term blip or a long-term trend. Investors should continue to monitor developments in FMC Corporation’s financial performance, and adjust their investment strategies accordingly.
Related Posts


Recent Posts


Investing Everyone Can Do.
Investing shouldn’t be exclusive to a select few. We believe everyone should have the opportunity to grow their wealth. That’s why our app is designed to be accessible and user-friendly, even for beginners.
