Boston Omaha Reports FY2023 Q1 Earnings Results on May 12, 2023
May 25, 2023

Earnings Overview
On May 12 2023, BOSTON OMAHA ($NYSE:BOC) reported their financial results for Q1 of FY2023, ending March 31 2023. Revenue reached USD 22.8 million, a surge of 40.1% from the same quarter of the prior year. Net income for the quarter was USD -3.3 million, a decrease from USD 16.3 million in the same quarter of the previous year.
Market Price
On Friday, May 12, 2023, BOSTON OMAHA released its FY2023 Q1 earning results. On the day, BOSTON OMAHA stock opened at $20.2 and closed at $20.2, representing a 0.8% increase from the previous closing price of $20.0. This marks the first release of earnings results since the company completed its IPO in early April of 2023. Analysts had been expecting a strong quarter for the company, and the numbers released on Friday indicate that BOSTON OMAHA is right on track to meeting its expected growth.
The strong earnings results indicate a continued success in BOSTON OMAHA’s operations and business model, with the company showing steady growth throughout the quarter. Investors seem to be viewing these results favorably and have responded with a positive reaction in the stock market. Although the stock only saw a slight bump in price on Friday, it is likely that this momentum will be carried over into future quarters. Live Quote…
About the Company
Income Snapshot
Below shows the total revenue, net income and net margin for Boston Omaha. More…
| Total Revenues | Net Income | Net Margin |
| 87.76 | -12.48 | -4.2% |
Cash Flow Snapshot
Below shows the cash from operations, investing and financing for Boston Omaha. More…
| Operations | Investing | Financing |
| 11.88 | -107.97 | 42.29 |
Balance Sheet Snapshot
Below shows the total assets, liabilities and book value per share for Boston Omaha. More…
| Total Assets | Total Liabilities | Book Value Per Share |
| 706.36 | 152.19 | 17.13 |
Key Ratios Snapshot
Some of the financial key ratios for Boston Omaha are shown below. More…
| 3Y Rev Growth | 3Y Operating Profit Growth | Operating Margin |
| 26.2% | – | -26.4% |
| FCF Margin | ROE | ROA |
| -34.4% | -2.8% | -2.0% |
Analysis
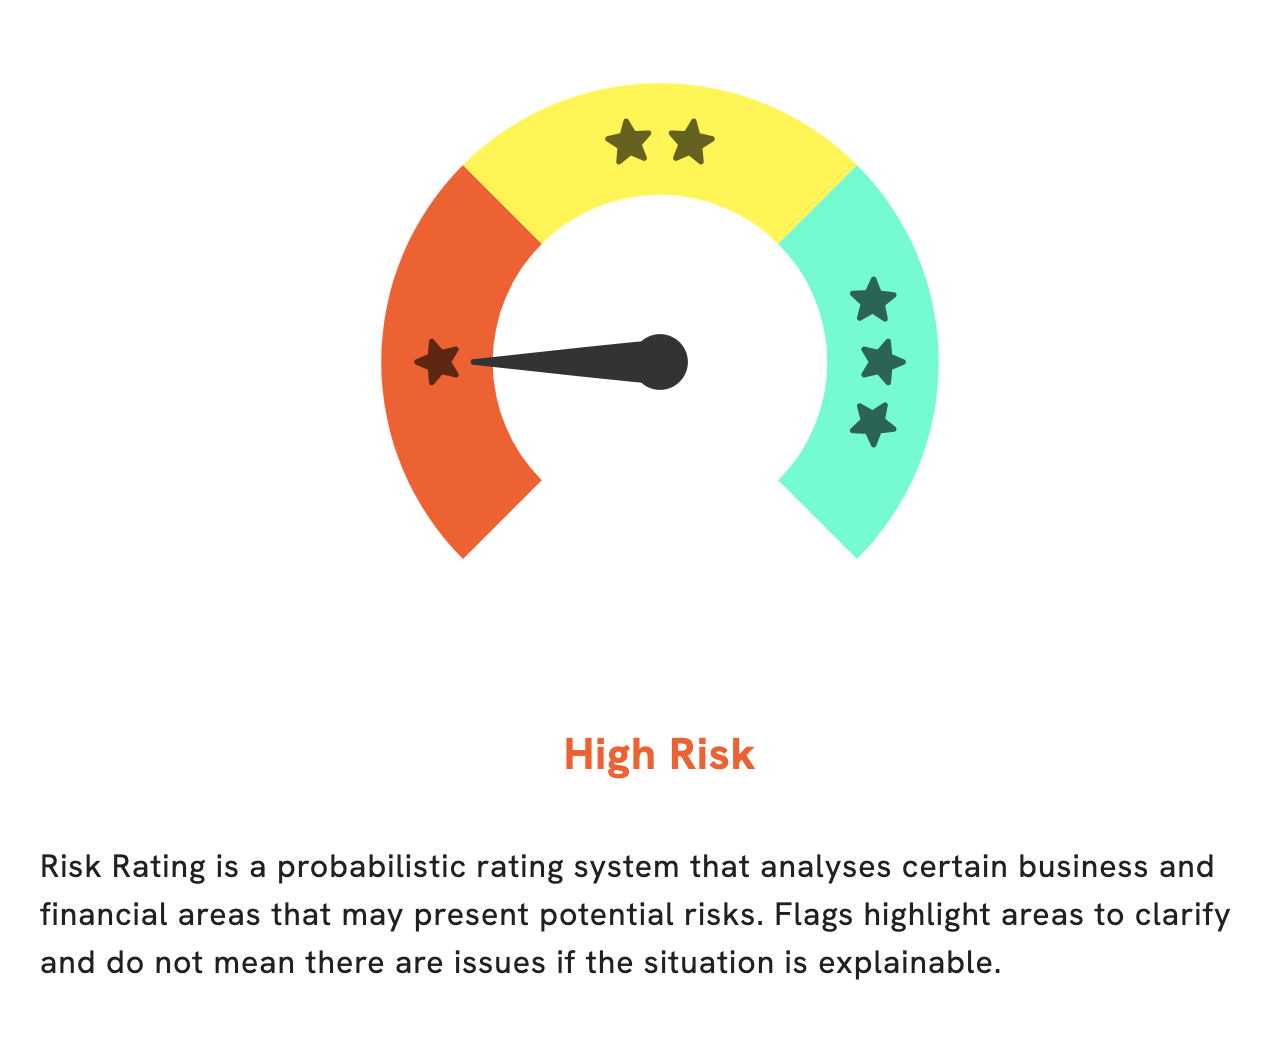
At GoodWhale, we recently conducted an analysis of BOSTON OMAHA’s financials. The results of our analysis showed that BOSTON OMAHA is a high risk investment in terms of financial and business aspects. We detected three risk warnings in the income sheet, balance sheet, and cashflow statement. If you would like to examine these warnings in more detail, be sure to register with us to gain access to our findings. Furthermore, our analysis revealed that BOSTON OMAHA’s profitability ratio is below average, meaning it has an unfavorable risk-reward tradeoff. We also noted that BOSTON OMAHA has an unusual current ratio, which indicates a potential liquidity issue. Our analysis of BOSTON OMAHA’s financials uncovered these and several other risk factors that merit further examination. Register with us to gain an in-depth understanding of the risks associated with this investment. More…

Peers
The competition between Boston Omaha Corp and its competitors is fierce. Each company is vying for a share of the market, and each has its own strengths and weaknesses. Innocean Worldwide Inc is a large company with a strong presence in the market. Domain Holdings Australia Ltd is a small company with a niche market. Nestbuilder.com Corp is a new company with a innovative product.
– Innocean Worldwide Inc ($KOSE:214320)
Innocean Worldwide Inc is a South Korean advertising agency. The company has a market cap of 843B as of 2022 and a Return on Equity of 9.71%. Innocean Worldwide Inc specializes in creating and executing integrated marketing campaigns for its clients. The company has a strong focus on digital marketing and has a team of experienced professionals who are experts in this field. Innocean Worldwide Inc has a wide range of clients, both in Korea and internationally, and has a proven track record of delivering successful campaigns.
– Domain Holdings Australia Ltd ($ASX:DHG)
Domain Holdings Australia Ltd is a digital media and services company. The company focuses on delivering an integrated suite of products and services that enable people to connect with each other and with the places they live, work and visit. Domain Holdings Australia Ltd has a market cap of 1.95B as of 2022, a Return on Equity of 4.18%. The company’s products and services include digital marketing, web design and development, and online advertising.
– Nestbuilder.com Corp ($OTCPK:NBLD)
Nestbuilder.com Corp is a company that provides online real estate services. The company has a market capitalization of 231.44k and a return on equity of -8065.9%. The company offers a variety of services including listings, home buying and selling tips, and mortgage information.
Summary
Boston Omaha is a promising investment opportunity for investors. The company recently reported its FY2023 Q1 earning results, with revenue up 40.1% year-over-year to USD 22.8 million. Despite this impressive growth, it reported a net loss of USD -3.3 million for the quarter, compared to a profit of USD 16.3 million in the same period last year.
Investors should carefully consider the company’s current financials before investing in Boston Omaha. Analyzing the company’s performance, cash flow, and other financial indicators can help investors make an informed decision about whether to invest in Boston Omaha.
Recent Posts


